MetroLink Task Force Summary
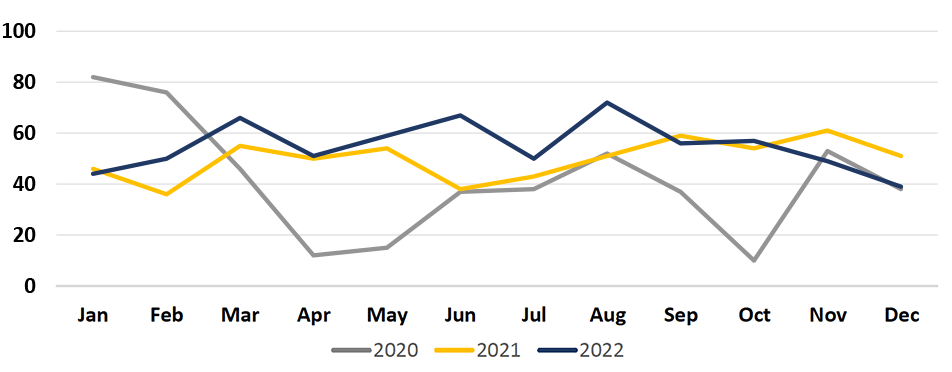
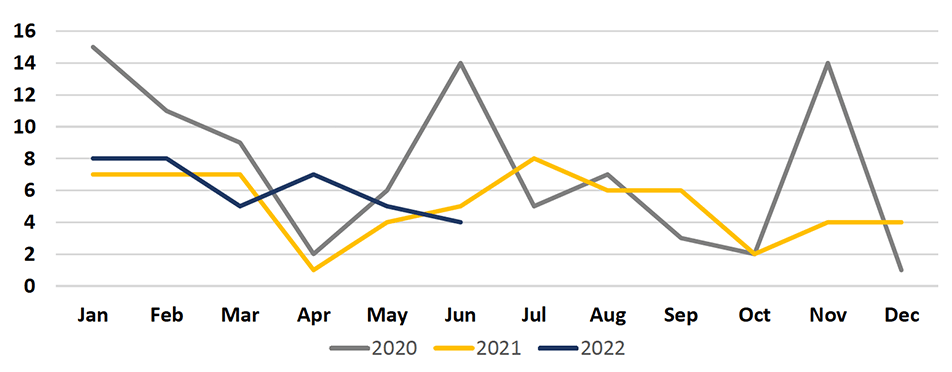
Task Force Incidents
|
|
2022 |
2023 |
| Quarter 1 |
160 |
236 |
| Quarter 2 |
174 |
249 |
| Quarter 3 |
178 |
|
| Quarter 4 |
145 |
|
Proactive Policing
|
|
Q1 |
Q2 |
Q3 |
Q4 |
| Directed |
120 |
144 |
|
|
| Proactive |
116 |
105 |
|
|
| Total |
236 |
249 |
|
|
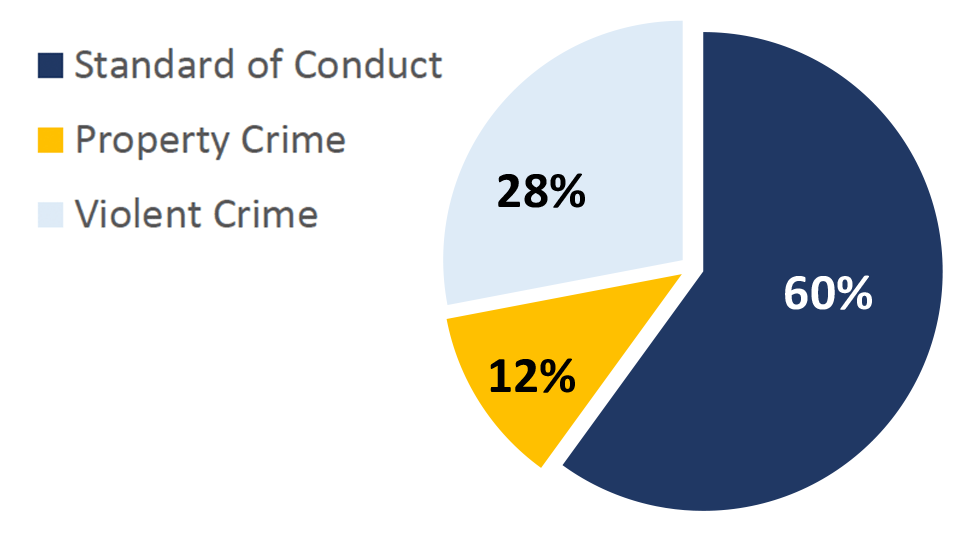
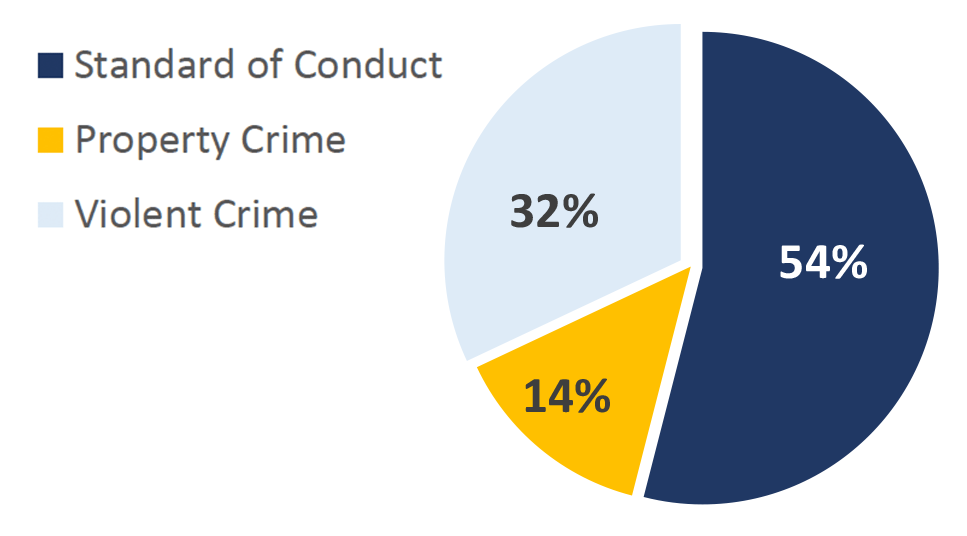
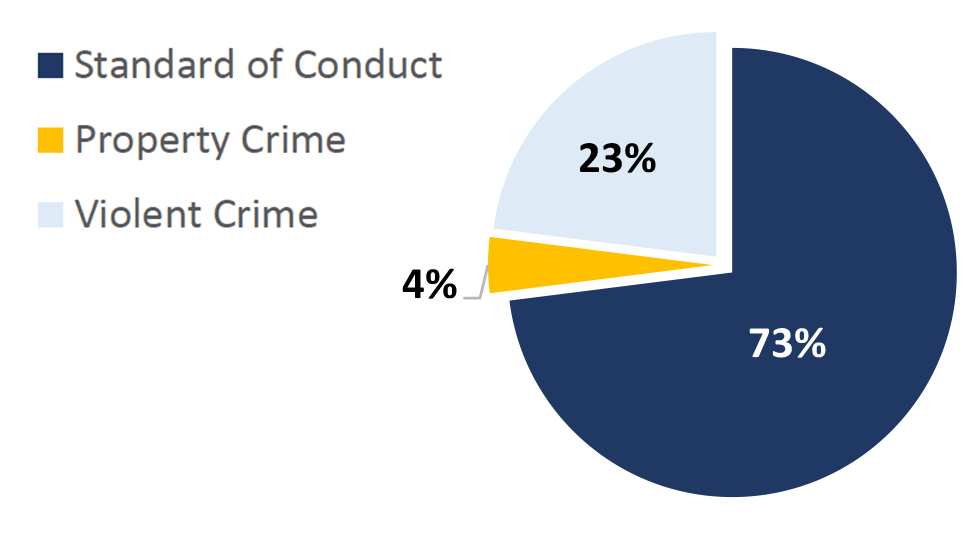
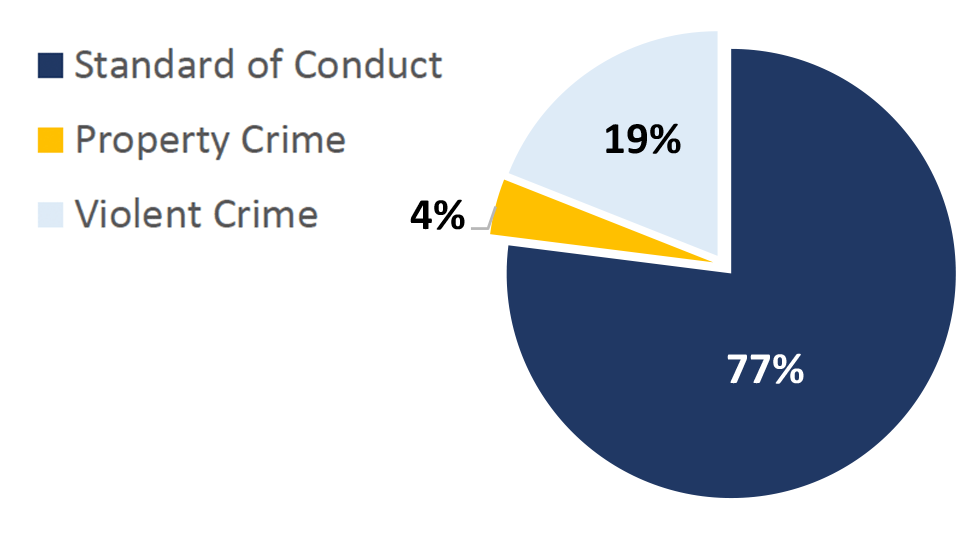
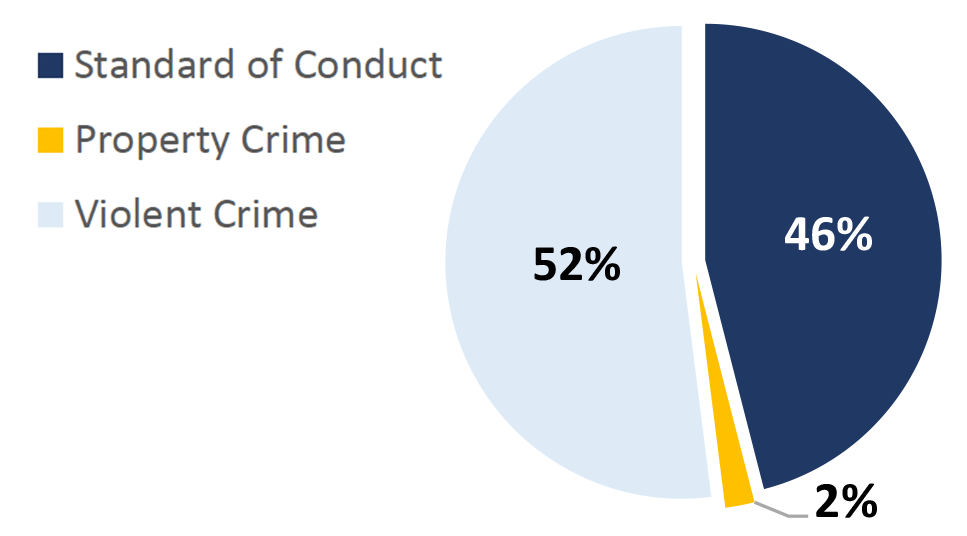
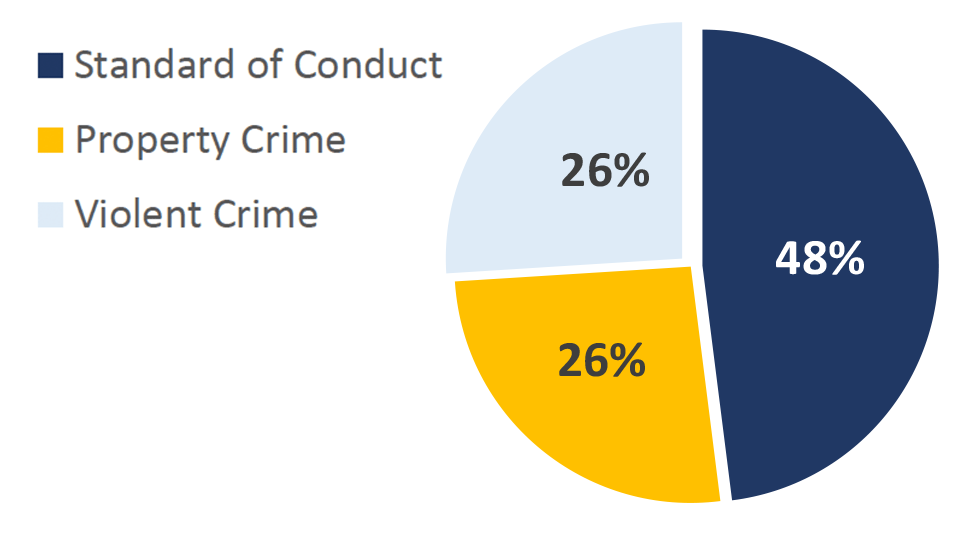
Offense Types
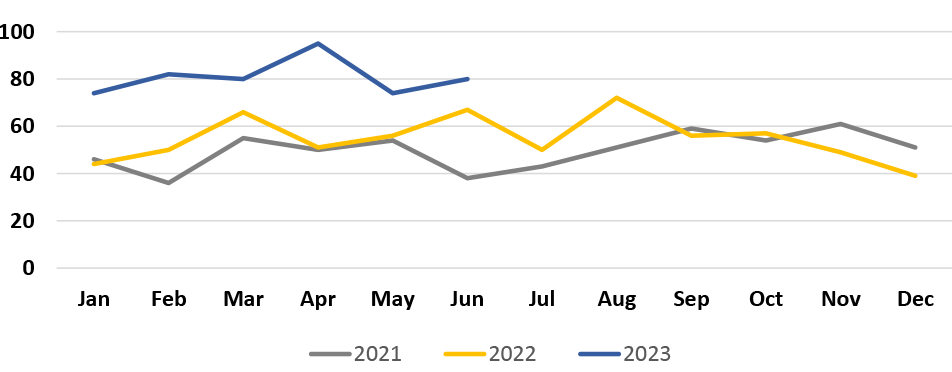
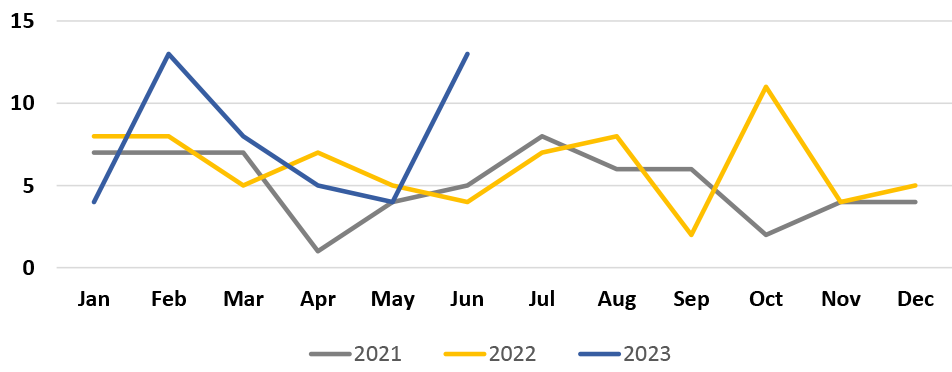
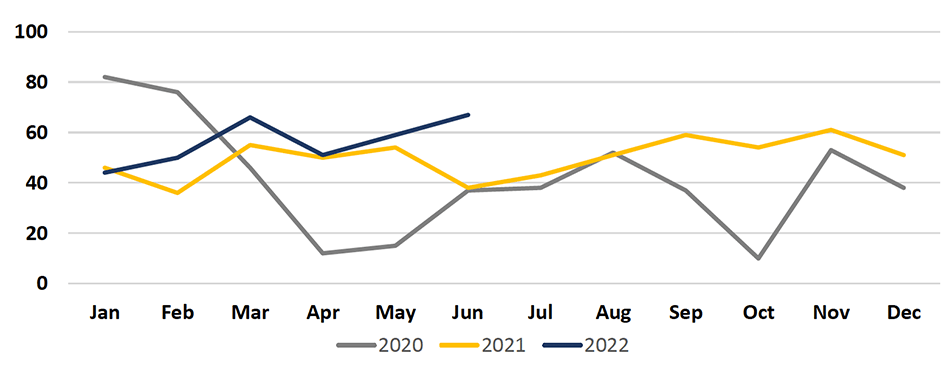
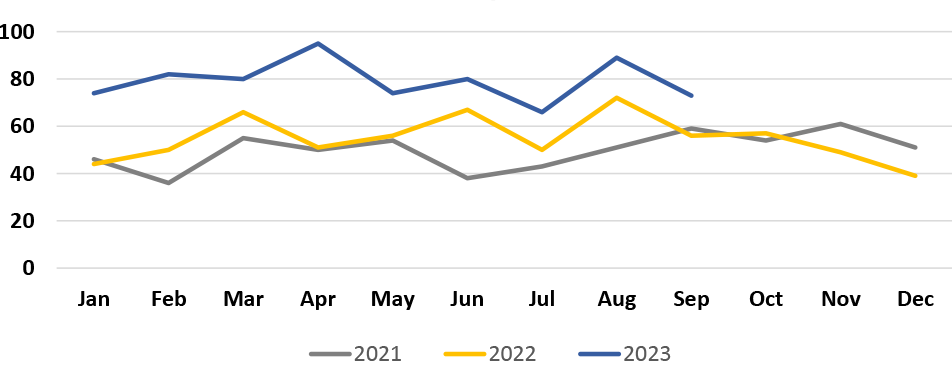
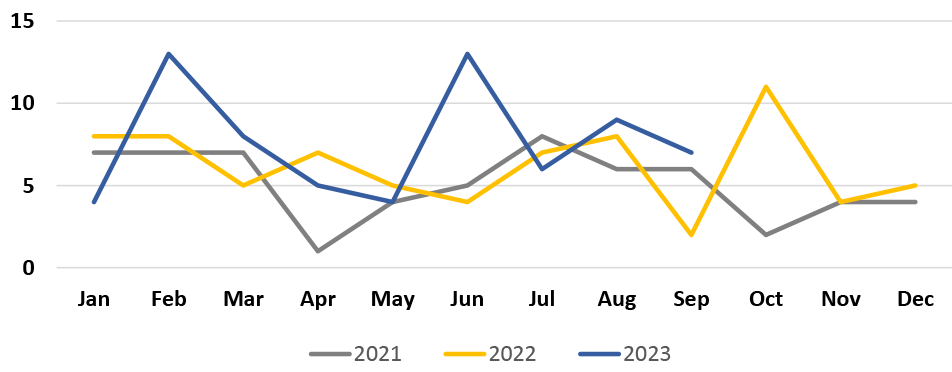
- MetroLink boardings decreased 3% compared to Q2 2022.
- Incidents per MetroLink boarding was .00014 (14 incidents per 100,000 boardings)
- The Task Force has a total of 67 contracted police officers.
- Nearly half (42%) of incident reports were self-initiated and generated by proactive policing.
- Nearly a fourth (22%) of Task Force Incidents were warrant arrests, likely the result of proactivity and the removal of known offenders from the system.
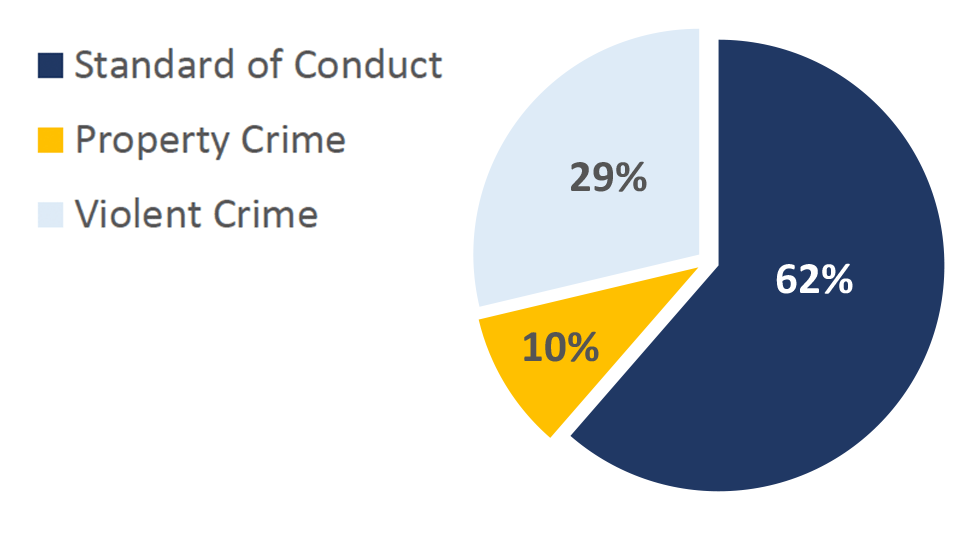
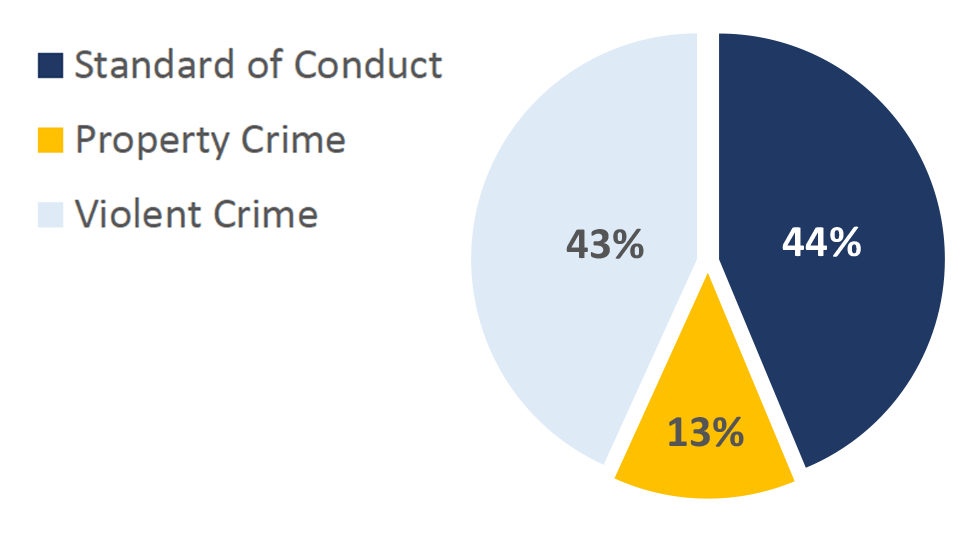
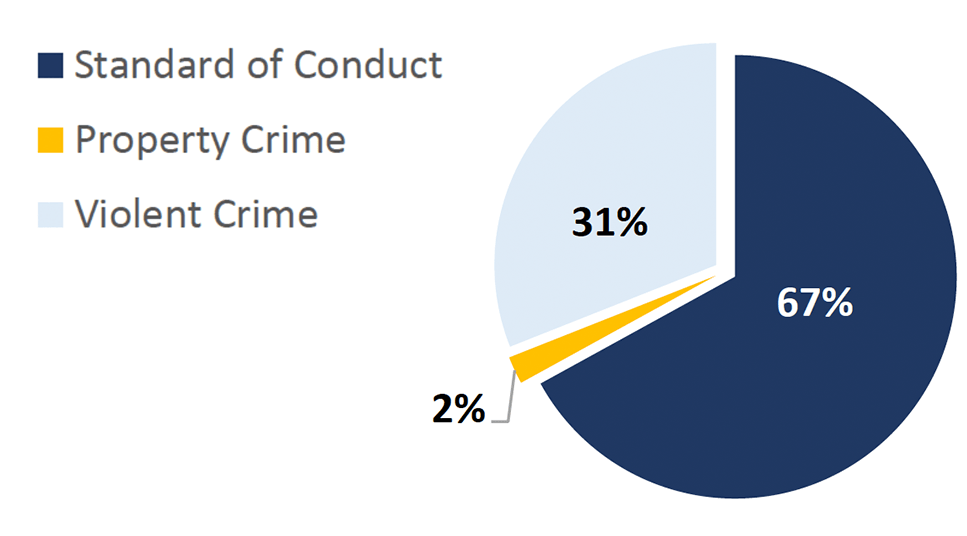
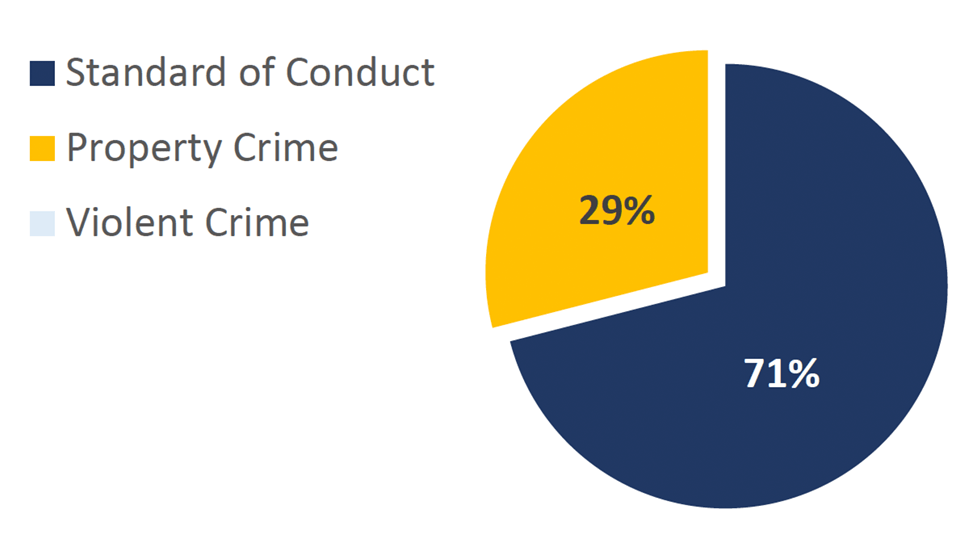
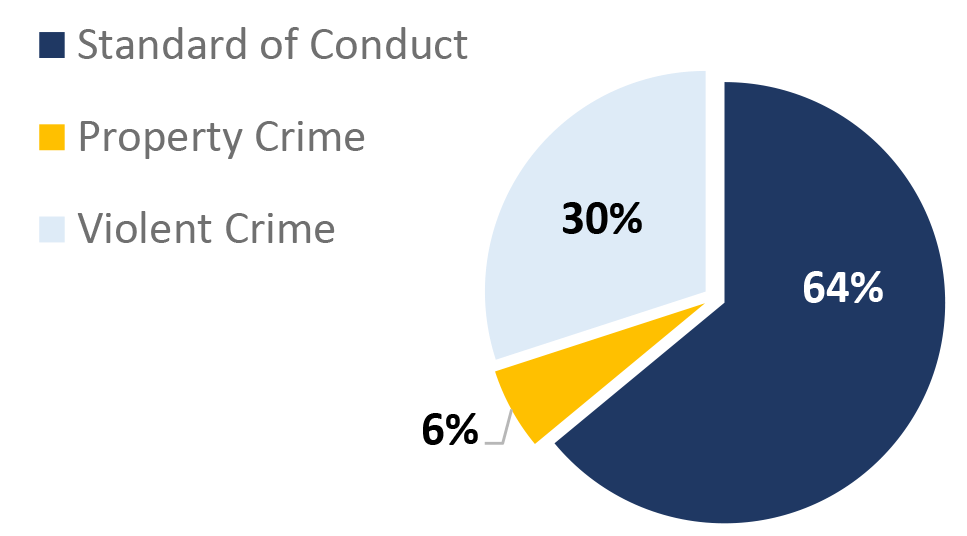
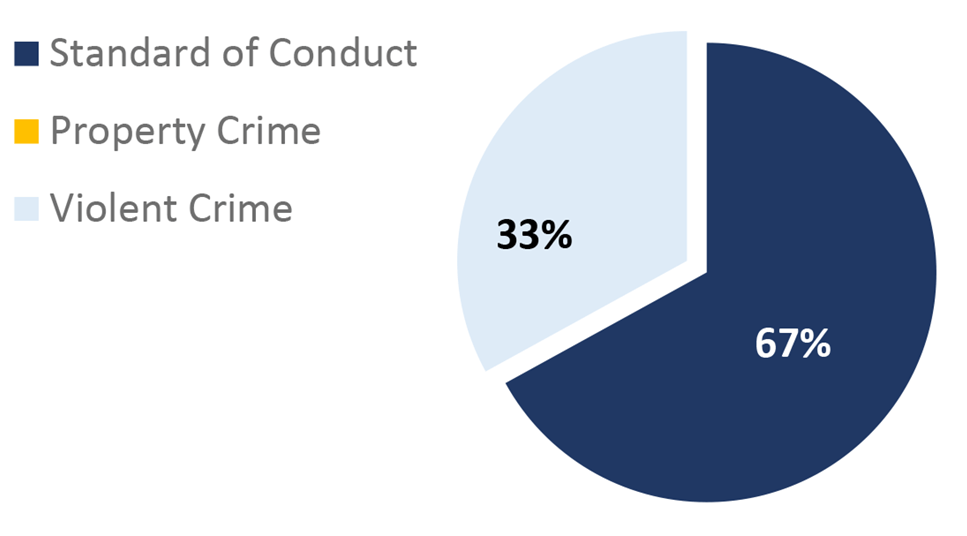
- Weapon violations accounted for 50% of the Violent Crime offense type, likely the result of proactive initiatives targeting known ‘hot spots’.
- Possession of a weapon on Metro property is a criminal offense and is classified as a ‘Violent Crime’ due to the potential threat to personal safety.
- Most of the Standard of Conduct offenses were trespassing violations (44%).
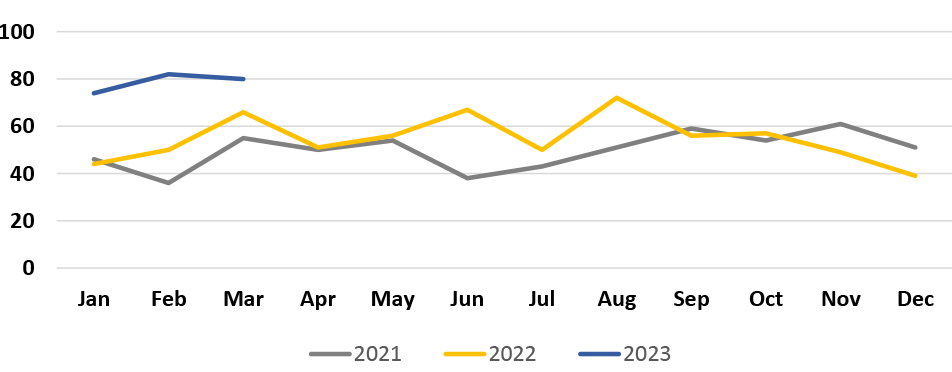
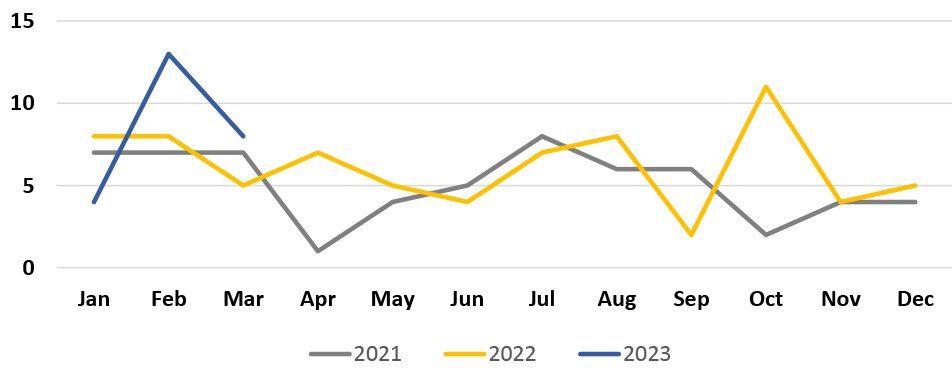
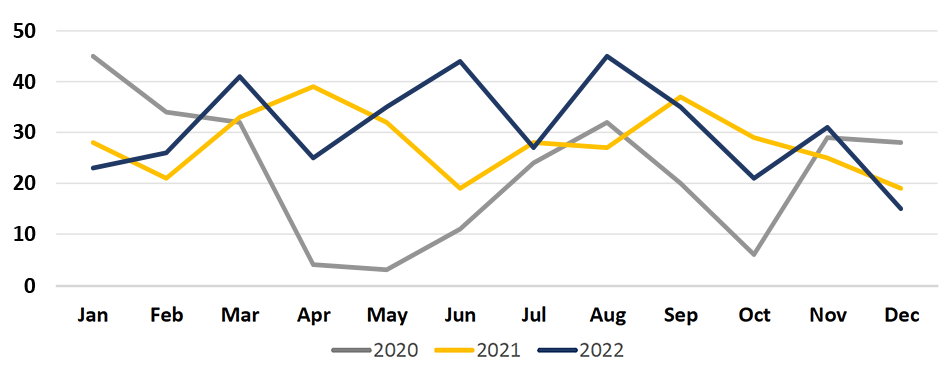
MetroLink Task Force Incidents
St. Louis County Police Department
St. Louis County Incidents
|
|
2022 |
2023 |
| Quarter 1 |
90 |
126 |
| Quarter 2 |
101 |
119 |
| Quarter 3 |
107 |
|
| Quarter 4 |
67 |
|
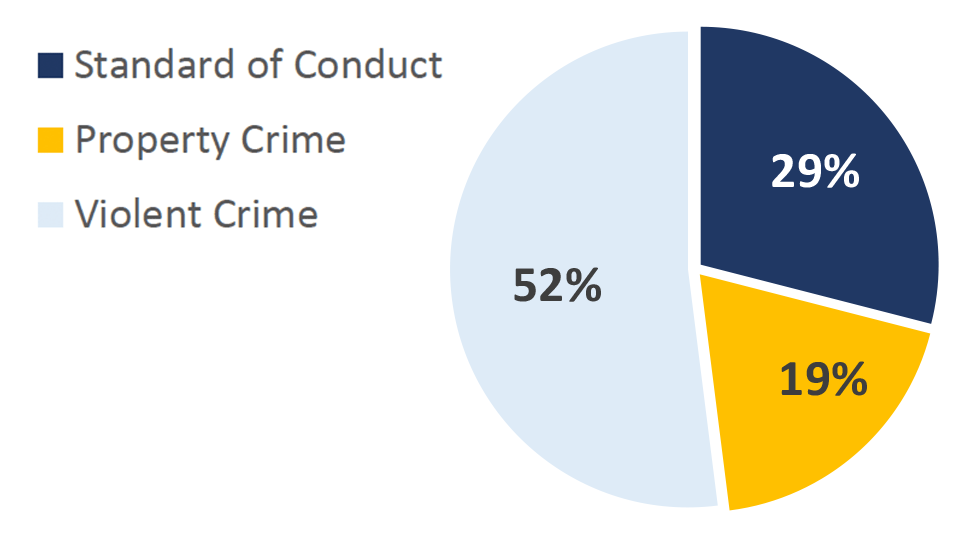
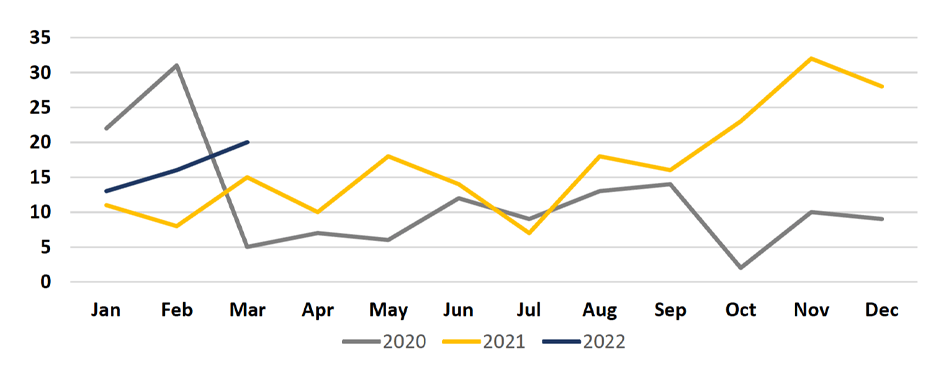
- St. Louis County Police Department has a total of 44 contracted police officers.
- Most (74%) of incident reports were self-initiated and generated by proactive policing.
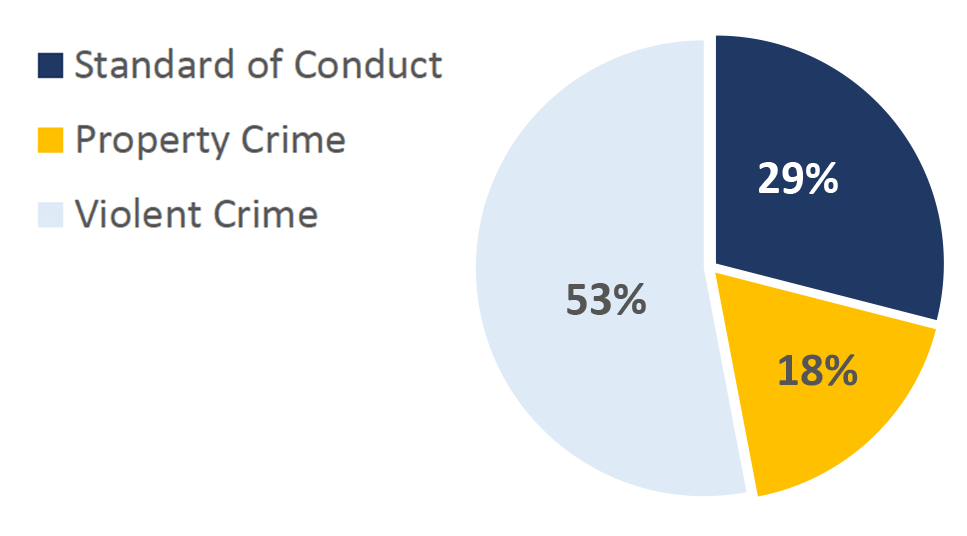
Offense Types
Incidents by Station
| MetroLink Station |
2022 |
2023 |
| Shrewsbury |
1 |
2 |
| Sunnen |
|
|
| Maplewood |
|
8 |
| Brentwood |
|
9 |
| RIchmond Heights |
|
5 |
| Clayton |
1 |
21 |
| Forsyth |
|
|
| U-City/Big Bend |
|
1 |
| Skinker |
|
|
| Forest Park |
|
|
| Central West End |
1 |
|
| Cortex |
|
|
| Lambert Main |
4 |
5 |
| Lambert East |
|
1 |
| North Hanley |
66 |
52 |
| UMSL North |
4 |
1 |
| UMSL South |
5 |
5 |
| Rock Road |
11 |
3 |
| Wellston |
6 |
6 |
| Delmar Loop |
2 |
|
| Alignment |
|
|
| TOTAL |
101 |
119 |
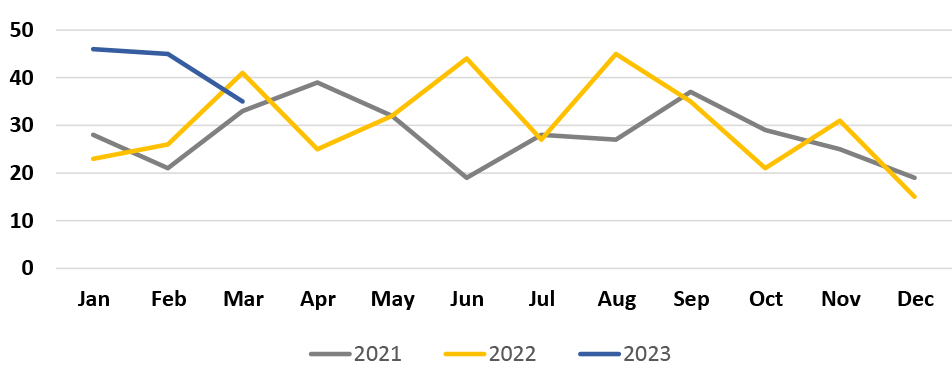
St. Louis County Incidents
St. Louis Metropolitan Police Department
St. Louis City Incidents
|
|
2022 |
2023 |
| Quarter 1 |
21 |
25 |
| Quarter 2 |
16 |
22 |
| Quarter 3 |
17 |
|
| Quarter 4 |
20 |
|
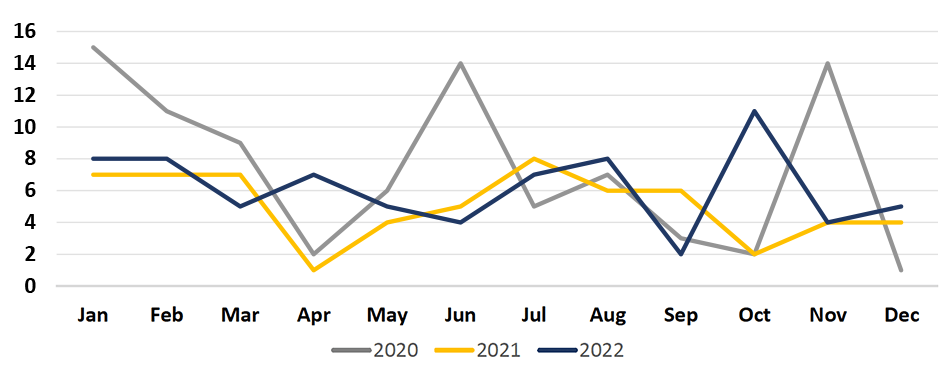
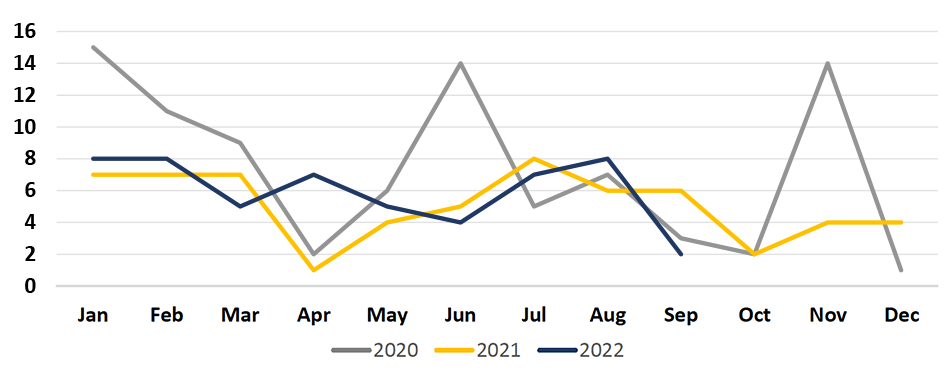
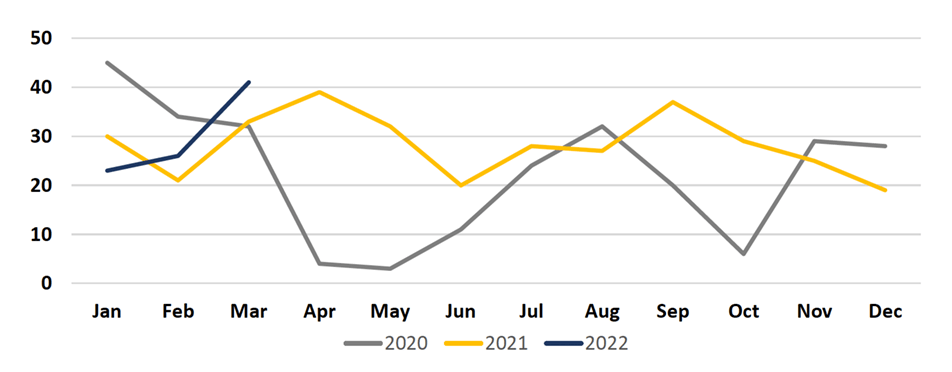
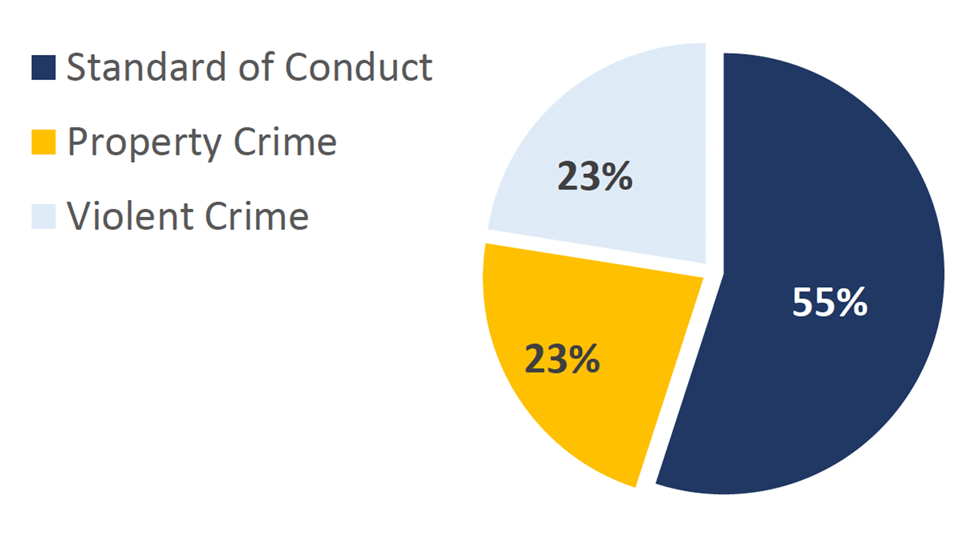
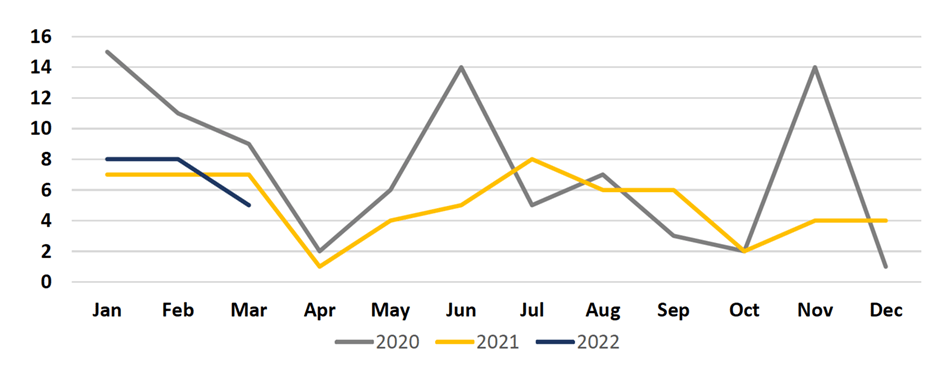
- St. Louis Metropolitan Police Department has a total of 8 contracted police officers.
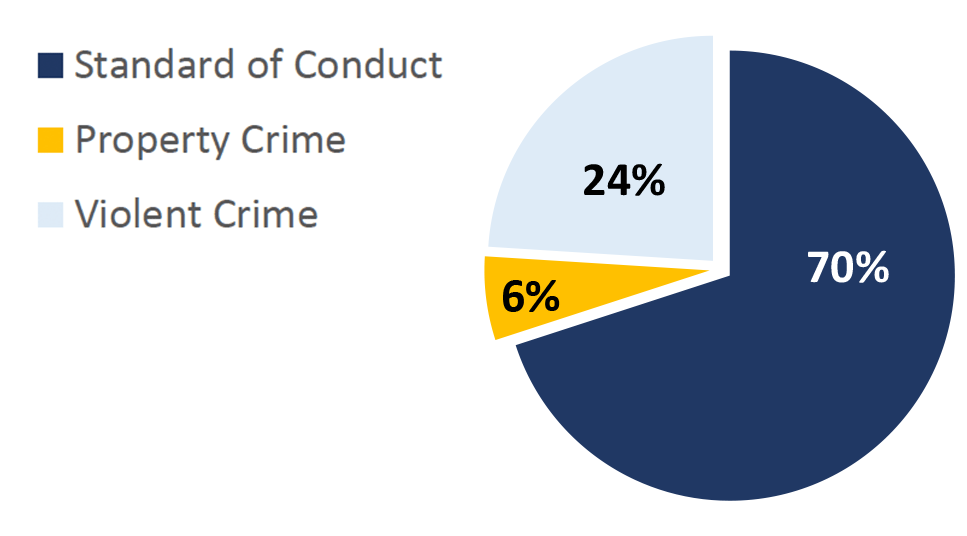
- Nearly a fourth (23%) of incident reports were self-initiated and generated by proactive policing.
Offense Types
Incidents by Station
| MetroLink Station |
2022 |
2023 |
| Shrewsbury |
|
|
| Skinker |
|
|
| Delmar Loop |
2 |
|
| Forest Park |
2 |
5 |
| Central West End |
3 |
4 |
| Cortex |
1 |
|
| Grand |
1 |
1 |
| Union Station |
2 |
1 |
| Civic Center |
3 |
5 |
| Stadium |
|
1 |
| 8th & Pine |
|
2 |
| Convention Center |
|
|
| Landing |
2 |
3 |
| TOTAL |
16 |
22 |
St. Louis City Incidents
St. Clair County Sheriff's Department
St. Clair County Incidents
|
|
2022 |
2023 |
| Quarter 1 |
49 |
85 |
| Quarter 2 |
57 |
108 |
| Quarter 3 |
54 |
|
| Quarter 4 |
58 |
|
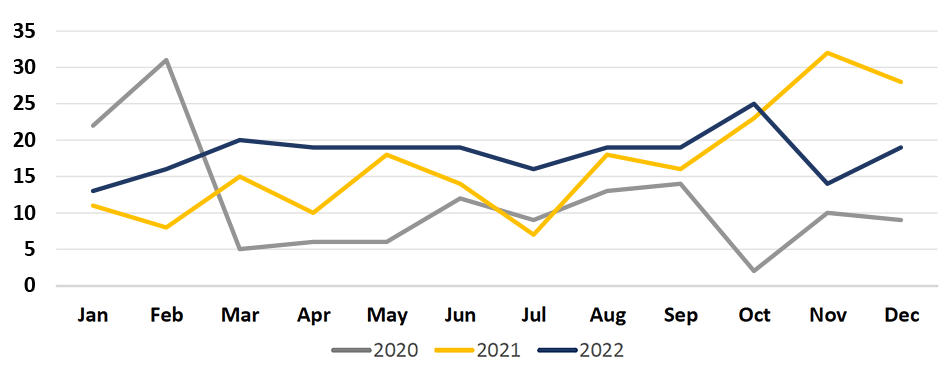
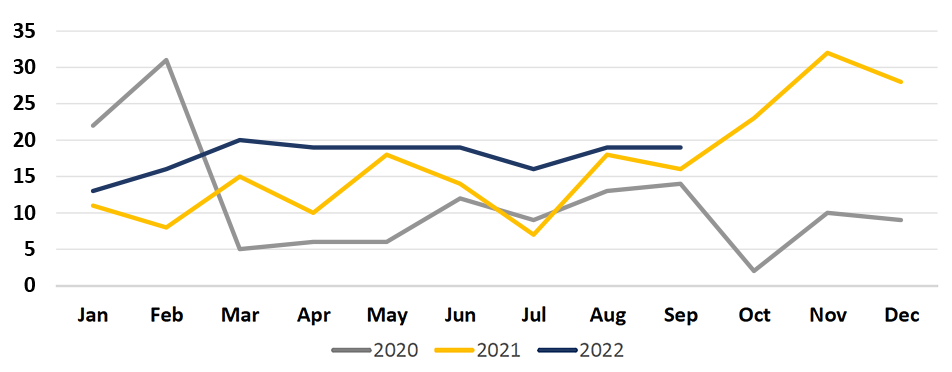
- St. Clair County Sheriff’s Department has a total of 15 contracted police officers.
- 11% of incident reports were self-initiated and generated by proactive policing.
Offense Types
Incidents by Station
| MetroLink Station |
2022 |
2023 |
| East Riverfront |
|
1 |
| 5th & Missouri |
9 |
18 |
| Emerson Park |
11 |
9 |
| Jackie Joyner-Kersee |
8 |
4 |
| Washington Park |
5 |
13 |
| Fairview Heights |
20 |
38 |
| Memorial Hospital |
2 |
8 |
| Swansea |
2 |
2 |
| Belleville |
|
3 |
| College |
|
1 |
| Shiloh-Scott |
|
10 |
| Alignment |
|
1 |
| TOTAL |
57 |
108 |
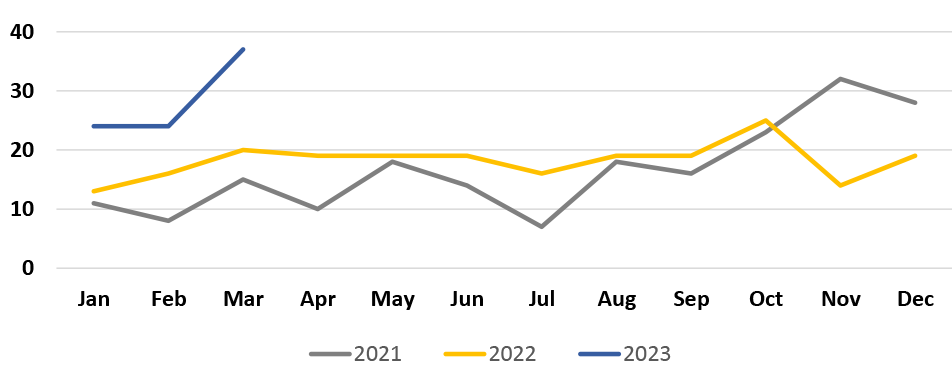
St. Clair County Incidents
MetroLink Task Force Summary
Task Force Incidents
|
|
2022 |
2023 |
| Quarter 1 |
160 |
236 |
| Quarter 2 |
174 |
|
| Quarter 3 |
178 |
|
| Quarter 4 |
145 |
|
Proactive Policing
|
|
Q1 |
Q2 |
Q3 |
Q4 |
| Directed |
120 |
|
|
|
| Proactive |
116 |
|
|
|
| Total |
236 |
|
|
|
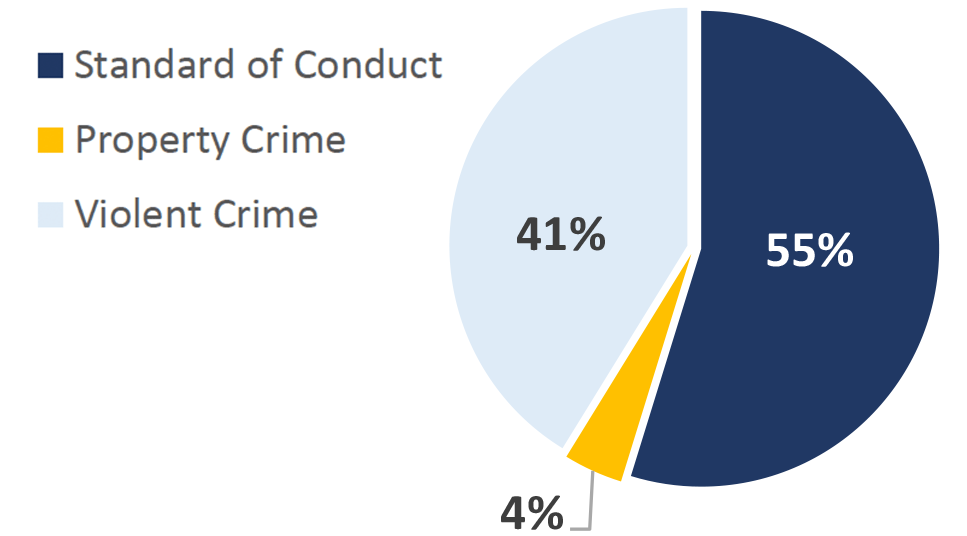
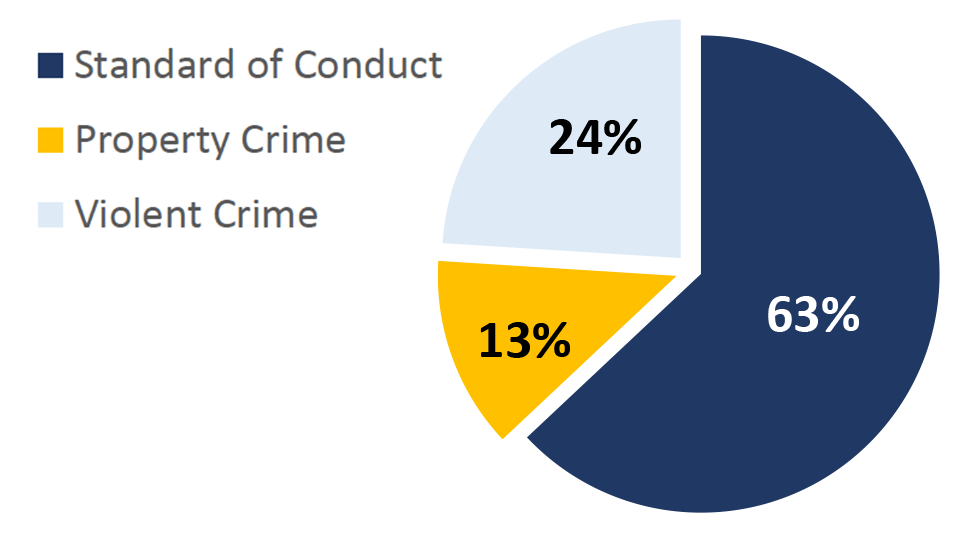
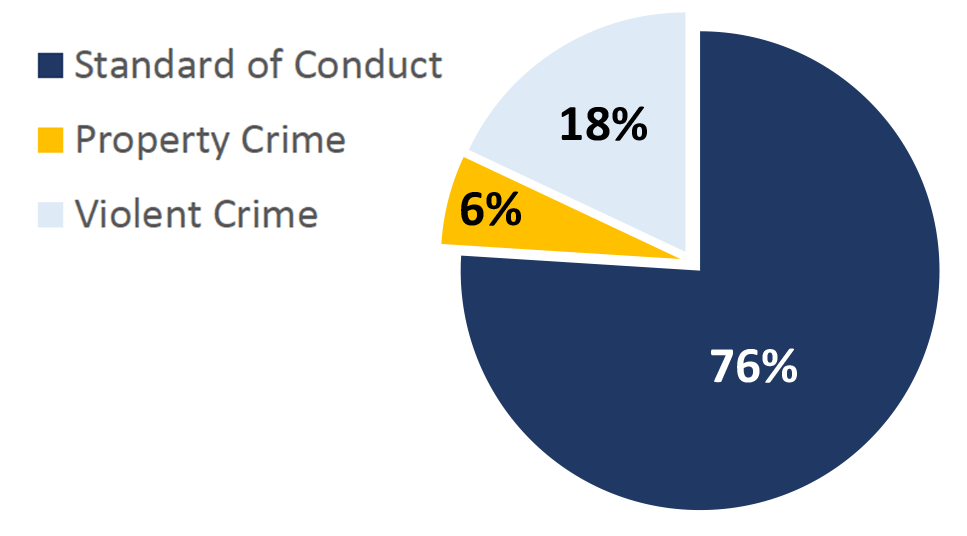
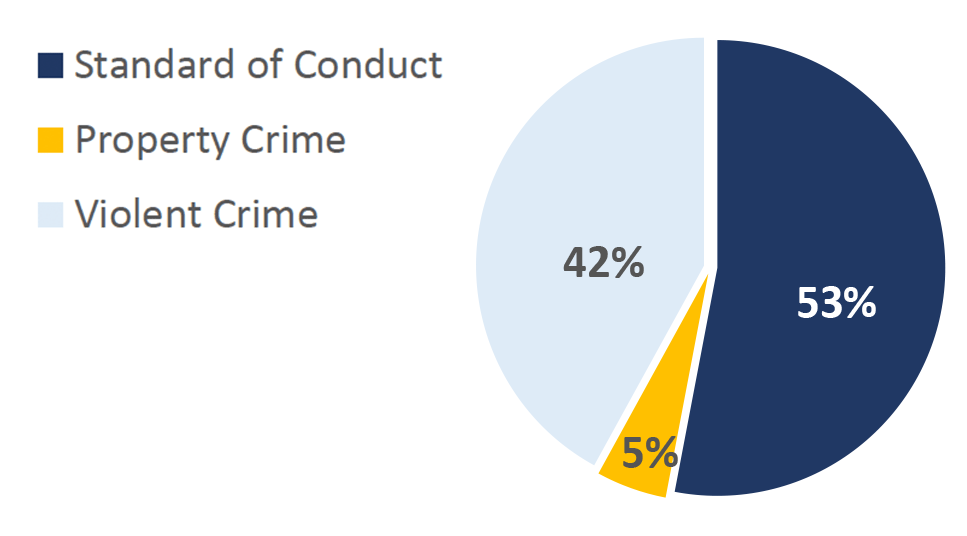
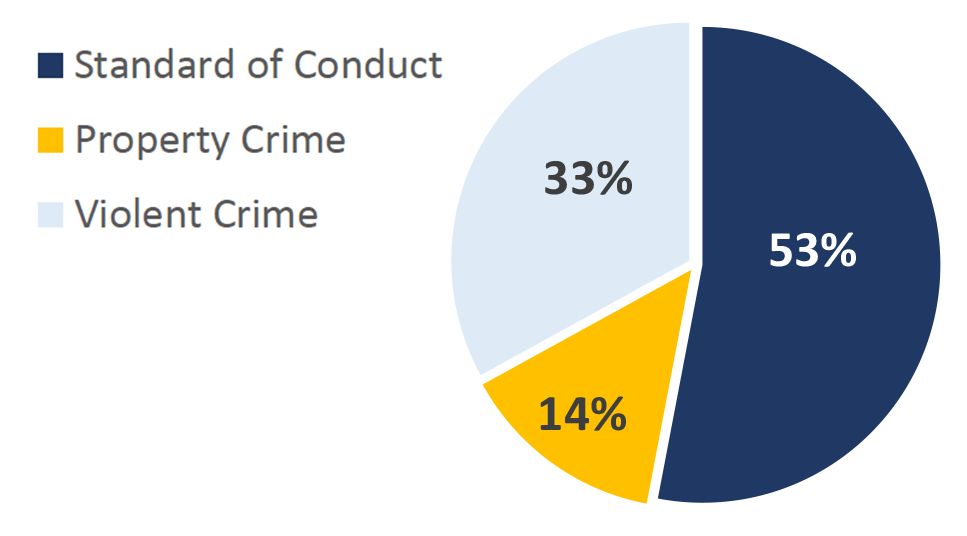
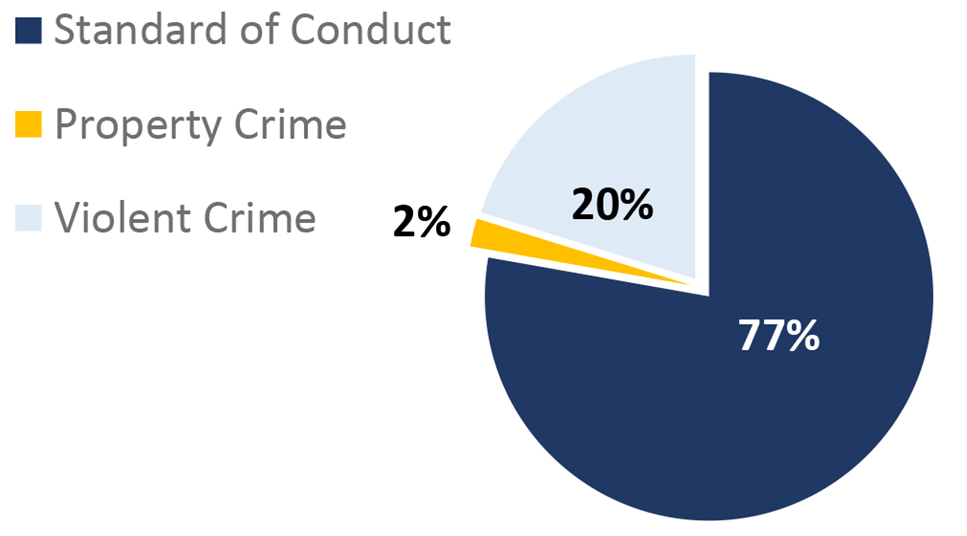
Offense Types
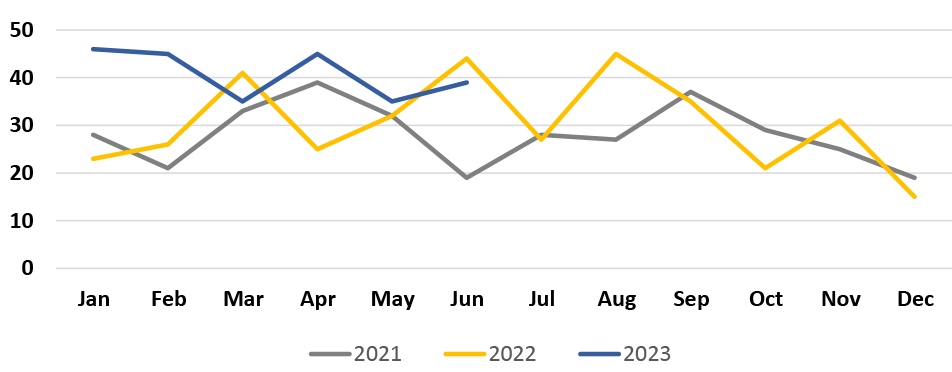
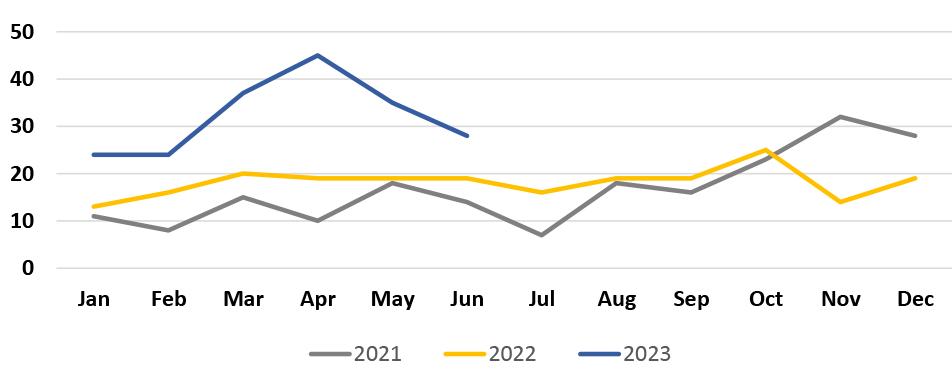
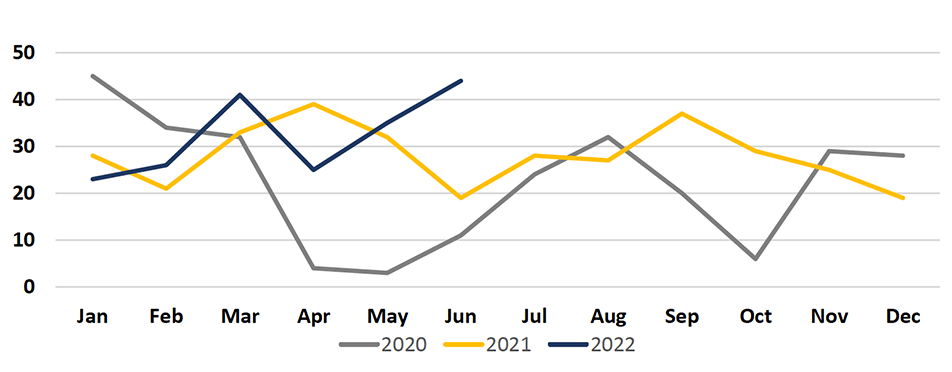
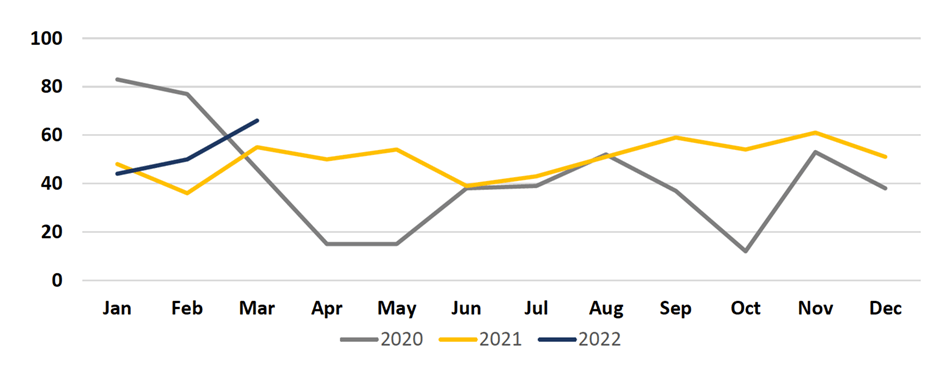
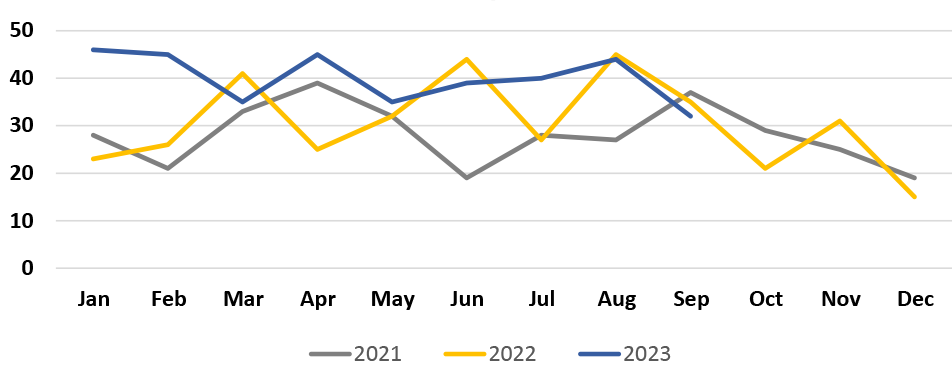
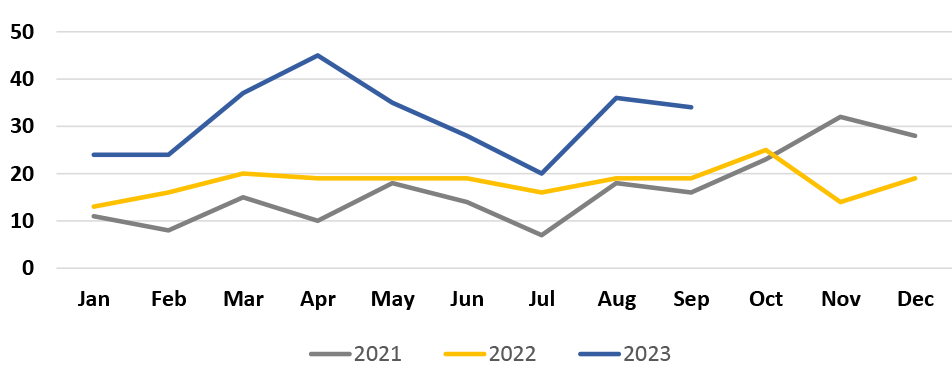
- MetroLink boardings increased 14% compared to Q1 2022.
- The Automatic Passenger Counting (APC) System experienced an outage; boardings for February 2023 were estimated using data from the previous month.
- Incidents per MetroLink boarding was .00015 (15 incidents per 100,000 boardings)
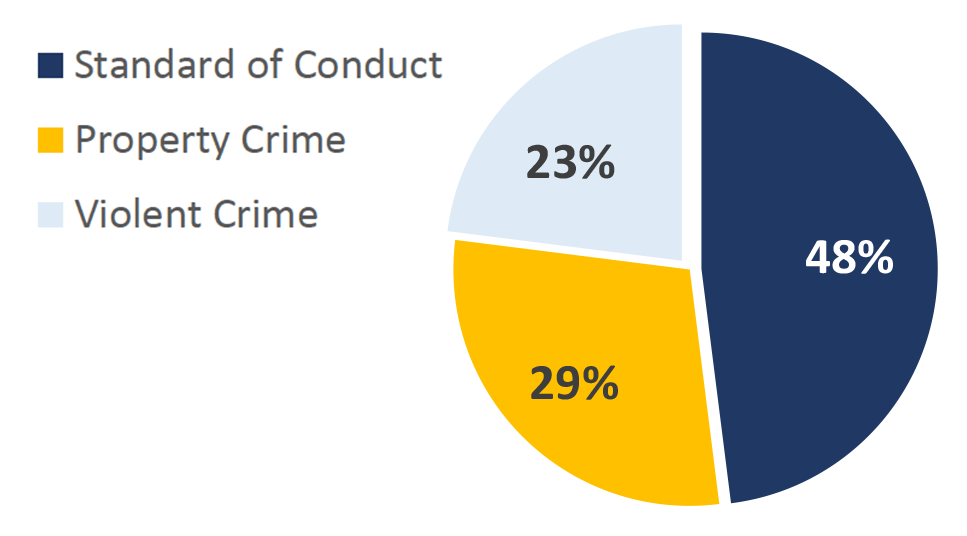
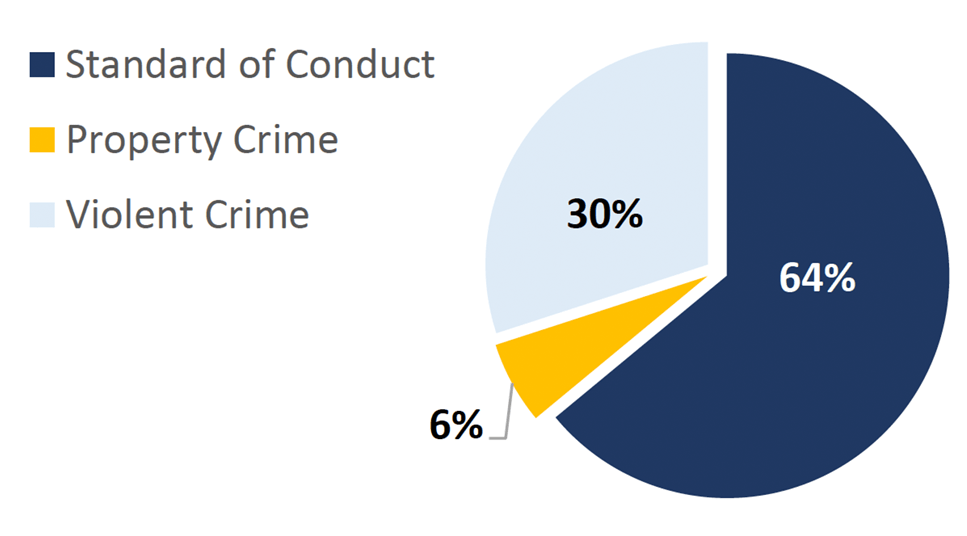
- Nearly half (49%) of incident reports were self-initiated and generated by proactive policing.
- Nearly a third (27%) of Task Force Incidents were warrant arrest, likely the result of proactivity and the removal of known offenders from the system.
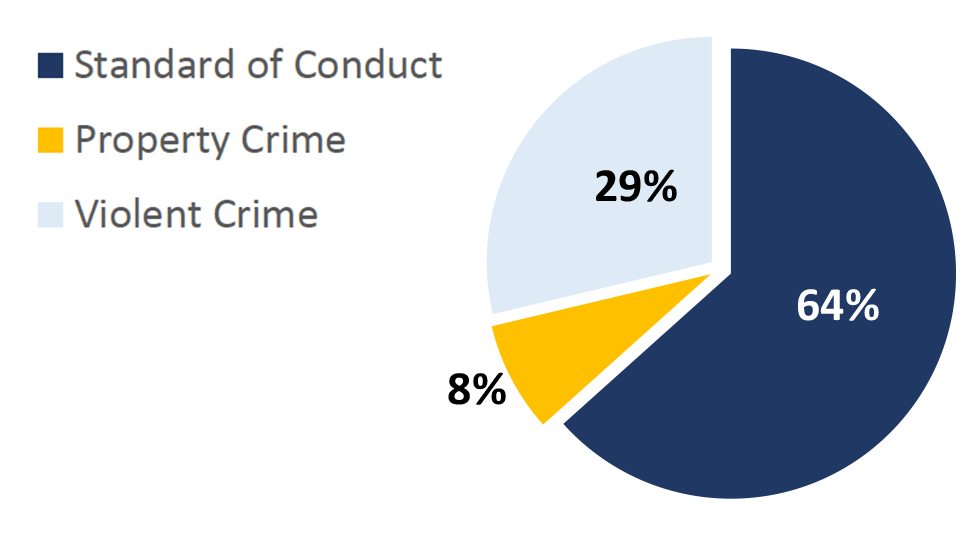
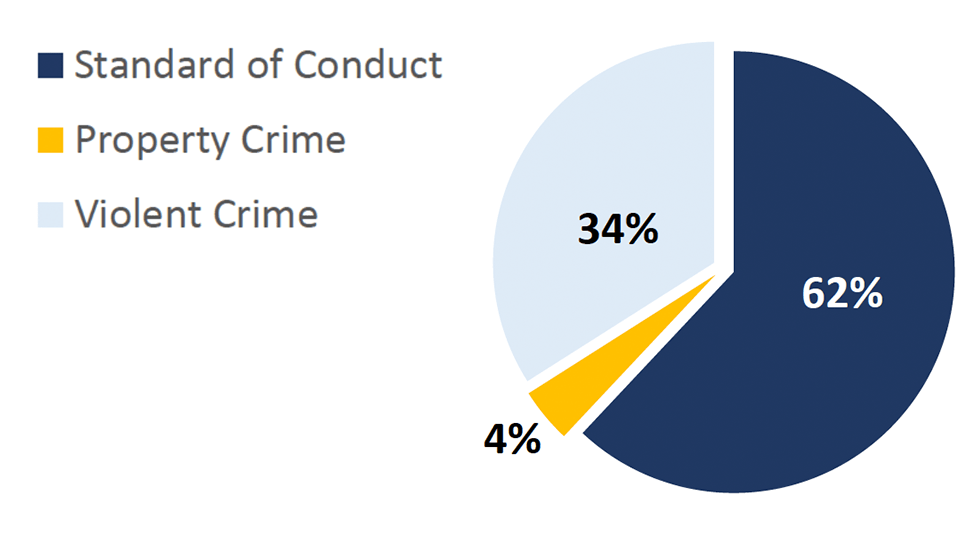
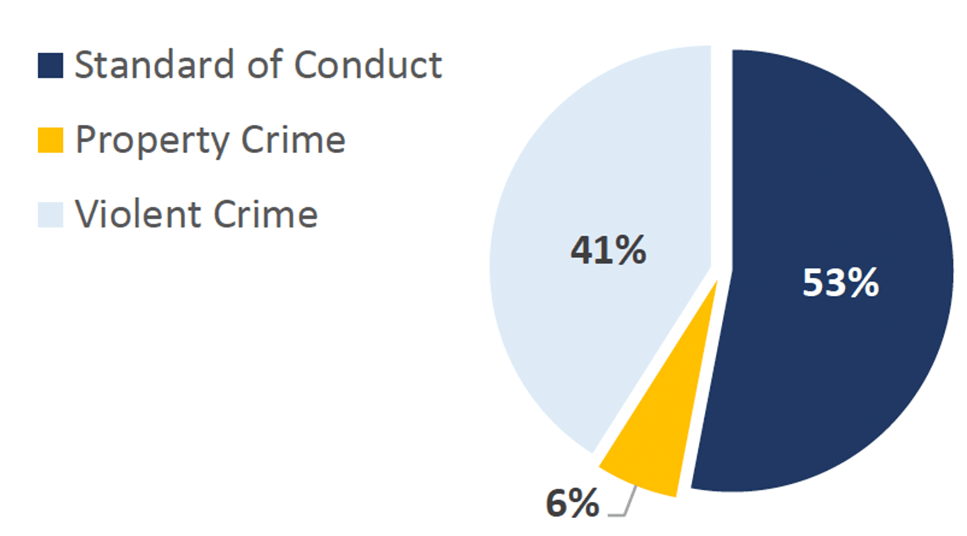
- Weapon violations accounted for 34% of the Violent Crime offense type, likely the result of proactive initiatives targeting known ‘hot spots’.
- Possession of a weapon on Metro property is a criminal offense and is classified as a ‘Violent Crime’ due to the potential threat to personal safety.
- Most of the Standard of Conduct offenses were ordinance violations (28%) and drug violations (27%).
MetroLink Task Force Incidents
St. Louis County Police Department
St. Louis County Incidents
|
|
2022 |
2023 |
| Quarter 1 |
90 |
126 |
| Quarter 2 |
101 |
|
| Quarter 3 |
107 |
|
| Quarter 4 |
67 |
|
Offense Types
Incidents by Station
| MetroLink Station |
2022 |
2023 |
| Shrewsbury |
|
1 |
| Sunnen |
|
3 |
| Maplewood |
1 |
3 |
| Brentwood |
|
5 |
| RIchmond Heights |
|
1 |
| Clayton |
|
4 |
| Forsyth |
|
2 |
| U-City/Big Bend |
|
|
| Skinker |
|
|
| Forest Park |
|
|
| Central West End |
|
|
| Cortex |
|
|
| Lambert Main |
|
3 |
| Lambert East |
|
|
| North Hanley |
66 |
76 |
| UMSL North |
5 |
3 |
| UMSL South |
7 |
6 |
| Rock Road |
7 |
11 |
| Wellston |
4 |
8 |
| Delmar Loop |
|
|
| TOTAL |
90 |
126 |
St. Louis County Incidents
St. Louis Metropolitan Police Department
St. Louis City Incidents
|
|
2022 |
2023 |
| Quarter 1 |
21 |
25 |
| Quarter 2 |
16 |
|
| Quarter 3 |
17 |
|
| Quarter 4 |
20 |
|
Offense Types
Incidents by Station
| MetroLink Station |
2022 |
2023 |
| Shrewsbury |
3 |
2 |
| Skinker |
|
|
| Delmar Loop |
3 |
|
| Forest Park |
1 |
3 |
| Central West End |
|
4 |
| Cortex |
2 |
1 |
| Grand |
2 |
4 |
| Union Station |
2 |
2 |
| Civic Center |
4 |
6 |
| Stadium |
|
|
| 8th & Pine |
2 |
|
| Convention Center |
|
1 |
| Landing |
2 |
2 |
| TOTAL |
21 |
25 |
St. Louis City Incidents
St. Clair County Sheriff's Department
St. Clair County Incidents
|
|
2022 |
2023 |
| Quarter 1 |
49 |
85 |
| Quarter 2 |
57 |
|
| Quarter 3 |
54 |
|
| Quarter 4 |
58 |
|
Offense Types
Incidents by Station
| MetroLink Station |
2022 |
2023 |
| East Riverfront |
2 |
|
| 5th & Missouri |
8 |
11 |
| Emerson Park |
7 |
8 |
| Jackie Joyner-Kersee |
2 |
8 |
| Washington Park |
5 |
8 |
| Fairview Heights |
13 |
22 |
| Memorial Hospital |
5 |
6 |
| Swansea |
2 |
5 |
| Belleville |
1 |
4 |
| College |
3 |
5 |
| Shiloh-Scott |
1 |
7 |
| Alignment |
|
1 |
| TOTAL |
49 |
85 |
St. Clair County Incidents
MetroLink Task Force Summary
Task Force Incidents
|
|
2021 |
2022 |
| Quarter 1 |
137 |
160 |
| Quarter 2 |
142 |
177 |
| Quarter 3 |
153 |
178 |
| Quarter 4 |
166 |
145 |
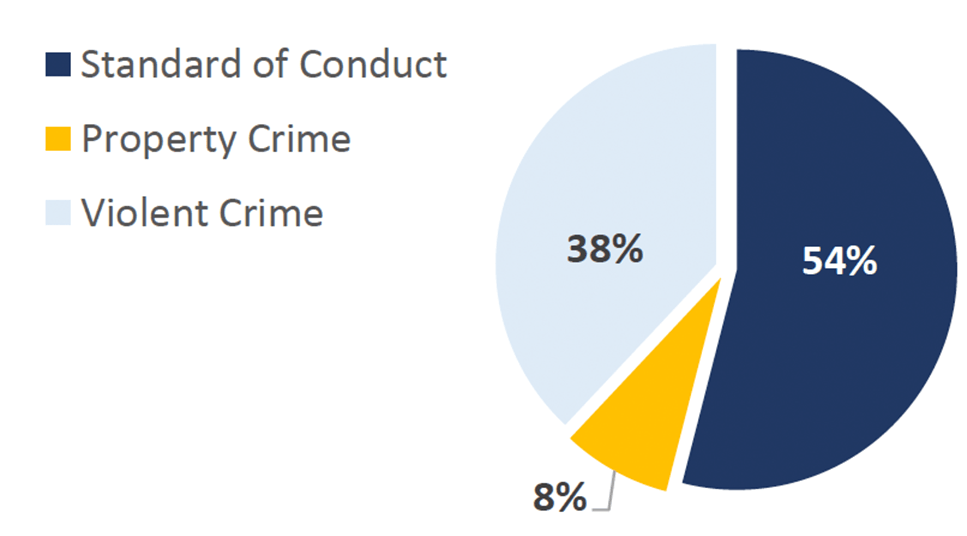
Offense Types
- MetroLink boardings increased 7%
- Incidents per MetroLink boarding was .00009 (9 incidents per 100,000 boardings)
- The majority (50%) of incident reports were self-initiated and generated by proactive policing
- Nearly a third (30%) of Task Force Incidents were warrant arrests, likely the result of proactivity and the removal of known offenders from the system
- Weapons violations accounted for 32% of the Violent Crime offense type, likely the result of proactive initiatives targeting known ‘hot spots’
- Nearly a third (31%) of Standard of Conduct offenses were trespassing; most were the proactive removal of known offenders in violation of the Ride & Abide Program.
MetroLink Task Force Incidents
St. Louis County Police Department
St. Louis County Incidents
|
|
2021 |
2022 |
| Quarter 1 |
82 |
90 |
| Quarter 2 |
90 |
104 |
| Quarter 3 |
92 |
107 |
| Quarter 4 |
73 |
67 |
- St. Louis County MetroLink boardings increased 2%
- Incidents per MetroLink boarding was .00012 (12 incidents per 100,000 MetroLink Boardings)
Offense Types
Incidents by Station
| MetroLink Station |
2021 |
2022 |
| Shrewsbury |
1 |
0 |
| Sunnen |
0 |
0 |
| Maplewood |
2 |
0 |
| Brentwood |
1 |
0 |
| RIchmond Heights |
1 |
0 |
| Clayton |
1 |
1 |
| Forsyth |
0 |
0 |
| U-City/Big Bend |
1 |
0 |
| Skinker |
0 |
0 |
| Forest Park |
0 |
0 |
| Central West End |
0 |
0 |
| Cortex |
0 |
0 |
| Lambert Main |
1 |
3 |
| Lambert East |
0 |
0 |
| North Hanley |
49 |
45 |
| UMSL North |
1 |
5 |
| UMSL South |
1 |
3 |
| Rock Road |
9 |
7 |
| Wellston |
4 |
2 |
| Delmar Loop |
1 |
1 |
| TOTAL |
73 |
67 |
St. Louis County Incidents
St. Louis Metropolitan Police Department
St. Louis City Incidents
|
|
2021 |
2022 |
| Quarter 1 |
21 |
21 |
| Quarter 2 |
10 |
16 |
| Quarter 3 |
20 |
17 |
| Quarter 4 |
10 |
20 |
- St. Louis City MetroLink boardings increased 14%
- Incidents per MetroLink boarding was .00003 (3 incidents per 100,000 MetroLink Boardings)
- Assaults accounted for 5 of the 8 violent crime offenses
Offense Types
Incidents by Station
| MetroLink Station |
2021 |
2022 |
| Lambert Main |
0 |
1 |
| Shrewsbury |
1 |
3 |
| Skinker |
1 |
0 |
| Delmar Loop |
1 |
2 |
| Forest Park |
1 |
3 |
| Central West End |
0 |
0 |
| Cortex |
2 |
0 |
| Grand |
0 |
3 |
| Union Station |
0 |
2 |
| Civic Center |
4 |
4 |
| Stadium |
0 |
0 |
| 8th & Pine |
0 |
2 |
| Convention Center |
0 |
0 |
| Landing |
0 |
0 |
| TOTAL |
10 |
20 |
St. Louis City Incidents
St. Clair County Sheriff's Department
St. Clair County Incidents
|
|
2021 |
2022 |
| Quarter 1 |
34 |
49 |
| Quarter 2 |
42 |
57 |
| Quarter 3 |
41 |
54 |
| Quarter 4 |
83 |
58 |
- St. Clair County MetroLink boardings increased 1%
- Incidents per MetroLink boarding was .00017 (17 incidents per 100,000 MetroLink Boardings)
- Nearly 50% of the incidents in Q4 were warrant arrests
Offense Types
Incidents by Station
| MetroLink Station |
2021 |
2022 |
| East Riverfront |
4 |
0 |
| 5th & Missouri |
13 |
7 |
| Emerson Park |
16 |
3 |
| Jackie Joyner-Kersee |
3 |
5 |
| Washington Park |
11 |
4 |
| Fairview Heights |
25 |
18 |
| Memorial Hospital |
1 |
7 |
| Swansea |
2 |
2 |
| Bellville |
6 |
3 |
| College |
1 |
3 |
| Shiloh-Scott |
1 |
5 |
| Alignment |
0 |
1 |
| TOTAL |
83 |
58 |
St. Clair County Incidents
MetroLink Task Force Summary
Task Force Incidents
|
|
2021 |
2022 |
| Quarter 1 |
137 |
160 |
| Quarter 2 |
142 |
177 |
| Quarter 3 |
153 |
178 |
| Quarter 4 |
166 |
|
Offense Types
- MetroLink boardings increased 7%
- Incidents per MetroLink boarding was .0001 (10 incidents per 100,000 boardings)
- The majority (62%) of incident reports were self-initiated and generated by proactive policing
- Nearly a third (28%) of Task Force Incidents were warrant arrests, likely the result of proactivity and the removal of known offenders from the system
- Weapons violations accounted for 47% of the Violent Crime offense type, likely the result of proactive initiatives targeting known ‘hot spots’
- Nearly a third (26%) of Standard of Conduct offenses were drug violations
MetroLink Task Force Incidents
St. Louis County Police Department
St. Louis County Incidents
|
|
2021 |
2022 |
| Quarter 1 |
82 |
90 |
| Quarter 2 |
90 |
104 |
| Quarter 3 |
92 |
107 |
| Quarter 4 |
73 |
|
- St. Louis County MetroLink boardings did not increase/decrease
- Incidents per MetroLink boarding was .00019 (19 incidents per 100,000 MetroLink Boardings)
Offense Types
Incidents by Station
| MetroLink Station |
2021 |
2022 |
| Shrewsbury |
0 |
1 |
| Sunnen |
3 |
0 |
| Maplewood |
1 |
0 |
| Brentwood |
2 |
1 |
| RIchmond Heights |
2 |
1 |
| Clayton |
4 |
1 |
| Forsyth |
2 |
0 |
| U-City/Big Bend |
0 |
0 |
| Skinker |
0 |
0 |
| Forest Park |
2 |
0 |
| Central West End |
0 |
0 |
| Cortex |
0 |
1 |
| Lambert Main |
1 |
2 |
| Lambert East |
0 |
0 |
| North Hanley |
58 |
75 |
| UMSL North |
0 |
2 |
| UMSL South |
3 |
6 |
| Rock Road |
8 |
13 |
| Wellston |
3 |
4 |
| Delmar Loop |
3 |
0 |
| TOTAL |
92 |
107 |
St. Louis County Incidents
St. Louis Metropolitan Police Department
St. Louis City Incidents
|
|
2021 |
2022 |
| Quarter 1 |
21 |
21 |
| Quarter 2 |
10 |
16 |
| Quarter 3 |
20 |
17 |
| Quarter 4 |
10 |
|
- St. Louis City MetroLink boardings increased 12%
- Incidents per MetroLink boarding was .00002 (2 incidents per 100,000 MetroLink Boardings)
Offense Types
Incidents by Station
| MetroLink Station |
2021 |
2022 |
| Shrewsbury |
1 |
1 |
| Skinker |
0 |
0 |
| Delmar Loop |
1 |
2 |
| Forest Park |
3 |
4 |
| Central West End |
4 |
2 |
| Cortex |
3 |
2 |
| Grand |
3 |
0 |
| Union Station |
1 |
0 |
| Civic Center |
1 |
3 |
| Stadium |
5 |
0 |
| 8th & Pine |
1 |
0 |
| Convention Center |
1 |
1 |
| Landing |
2 |
2 |
| TOTAL |
20 |
17 |
St. Louis City Incidents
St. Clair County Sheriff's Department
St. Clair County Incidents
|
|
2021 |
2022 |
| Quarter 1 |
34 |
49 |
| Quarter 2 |
42 |
57 |
| Quarter 3 |
41 |
54 |
| Quarter 4 |
83 |
|
- St. Clair County MetroLink boardings increased 8%
- Incidents per MetroLink boarding was .00014 (14 incidents per 100,000 MetroLink Boardings)
- Nearly 50% of the incidents in Q3 were warrant arrests
Offense Types
Incidents by Station
| MetroLink Station |
2021 |
2022 |
| East Riverfront |
2 |
3 |
| 5th & Missouri |
8 |
7 |
| Emerson Park |
8 |
6 |
| Jackie Joyner-Kersee |
2 |
1 |
| Washington Park |
2 |
8 |
| Fairview Heights |
16 |
10 |
| Memorial Hospital |
1 |
9 |
| Swansea |
1 |
1 |
| Bellville |
0 |
3 |
| College |
1 |
2 |
| Shiloh-Scott |
0 |
3 |
| Alignment |
0 |
1 |
| TOTAL |
41 |
54 |
St. Clair County Incidents
MetroLink Task Force Summary
Task Force Incidents
|
|
2021 |
2022 |
| Quarter 1 |
137 |
160 |
| Quarter 2 |
142 |
177 |
| Quarter 3 |
153 |
|
| Quarter 4 |
166 |
|
Offense Types
- MetroLink boardings increased 18%
- MetroLink boardings increased 26%
- Incidents per MetroLink boarding is .0001 (10 incidents per 100,000 boardings)
- The majority (71%) of incident reports were self initiated and generated by proactive policing.
- Nearly a third 28%) of Task Force Incidents were warrant arrest, likely the result of proactivity and the removal of known offenders from the system.
- Weapon violations account for 44% of the violent offense types. Likely the result of pro active initiatives targeting known ‘hot spots.’
- A third (33%) of standard of conduct offenses are drug violations.
MetroLink Task Force Incidents
St. Louis County Police Department
St. Louis County Incidents
|
|
2021 |
2022 |
| Quarter 1 |
82 |
90 |
| Quarter 2 |
90 |
104 |
| Quarter 3 |
92 |
|
| Quarter 4 |
73 |
|
- St. Louis County MetroLink boardings increased 25%
- Incident per MetroLink boarding is .00017 (17 incidents per 100,000 MetroLink Boardings)
Offense Types
Incidents by Station
| MetroLink Station |
2021 |
2022 |
| Shresbury |
0 |
1 |
| Sunnen |
2 |
|
| Maplewood |
3 |
|
| Brentwood |
1 |
|
| RIchmond Heights |
1 |
|
| Clayton |
3 |
1 |
| Forsyth |
|
|
| U-City/Big Bend |
|
|
| Skinker |
|
|
| Forest Park |
|
|
| Central West End |
|
1 |
| Lambert Main |
1 |
4 |
| Lambert East |
|
|
| North Hanley |
54 |
68 |
| UMSL North |
|
4 |
| UMSL South |
9 |
5 |
| Rock Road |
7 |
12 |
| Wellston |
7 |
6 |
| Delmar Loop |
1 |
2 |
| Alignment |
1 |
|
| TOTAL |
90 |
104 |
St. Louis County Incidents
St. Louis Metropolitan Police Department
St. Louis City Incidents
|
|
2021 |
2022 |
| Quarter 1 |
21 |
21 |
| Quarter 2 |
10 |
16 |
| Quarter 3 |
20 |
|
| Quarter 4 |
10 |
|
- St. Louis City MetroLink boardings increased 29%
- Incident per MetroLink boarding is .00002 (2 incidents per 100,000 MetroLink Boardings)
Offense Types
Incidents by Station
| MetroLink Station |
2021 |
2022 |
| Shrewsbury |
1 |
|
| Skinker |
|
|
| Delmar Loop |
1 |
2 |
| Forest Park |
1 |
2 |
| Central West End |
1 |
1 |
| Cortex |
1 |
1 |
| Grand |
2 |
1 |
| Union Station |
1 |
2 |
| Civic Center |
1 |
3 |
| Stadium |
|
|
| 8th & Pine |
|
|
| Convention Center |
|
|
| Landing |
1 |
2 |
| TOTAL |
10 |
16 |
St. Louis City Incidents
St. Clair County Sheriff's Department
St. Clair County Incidents
|
|
2021 |
2022 |
| Quarter 1 |
34 |
49 |
| Quarter 2 |
42 |
57 |
| Quarter 3 |
41 |
|
| Quarter 4 |
83 |
|
- St. Clair County MetroLink boardings increased 24%
- Incident per MetroLink boarding is .00014 (14 incidents per 100,000 MetroLink Boardings)
- Nearly 50% of the incidents in Q2 were warrant arrests
Offense Types
Incidents by Station
| MetroLink Station |
2021 |
2022 |
| East Riverfront |
2 |
|
| 5th & Missouri |
9 |
9 |
| Emerson Park |
7 |
11 |
| Jackie Joyner-Kersee |
1 |
8 |
| Washington Park |
4 |
5 |
| Fairview Heights |
13 |
20 |
| Memorial Hospital |
|
2 |
| Swansea |
1 |
2 |
| Bellville |
3 |
|
| College |
1 |
|
| Shiloh-Scott |
1 |
|
| Alignment |
|
|
| TOTAL |
42 |
57 |
St. Clair County Incidents
MetroLink Task Force Summary
Task Force Incidents
|
|
2021 |
2022 |
| Quarter 1 |
137 |
160 |
| Quarter 2 |
143 |
|
| Quarter 3 |
153 |
|
| Quarter 4 |
166 |
|
Offense Types
- MetroLink boardings increased 18%
- Incidents per MetroLink boarding is .00011 (11 incidents per 100,000 boardings)
- The majority (61%) of incident reports were self initiated and generated by proactive policing.
- Nearly a third 30%) of Task Force Incidents were warrant arrest, likely the result of proactivity and the removal of known offenders from the system.
- Weapon violations account for 58% of the violent offense types. Likely the result of pro active initiatives targeting known ‘hot spots.’
- The majority of standard of conduct offenses are trespassing and drug violations.
MetroLink Task Force Incidents
St. Louis County Police Department
St. Louis County Incidents
|
|
2021 |
2022 |
| Quarter 1 |
84 |
90 |
| Quarter 2 |
91 |
|
| Quarter 3 |
92 |
|
| Quarter 4 |
73 |
|
- St. Louis County MetroLink boardings increased 16%
- Incident per MetroLink boarding is .00017 (17 incidents per 100,000 MetroLink Boardings)
Offense Types
Incidents by Station
| MetroLink Station |
2021 |
2022 |
| Shrewsbury |
1 |
|
| Sunnen |
|
|
| Maplewood |
1 |
1 |
| Brentwood |
1 |
|
| Richmond Heights |
1 |
|
| Clayton |
1 |
|
| Forsyth |
1 |
|
| U-City/Big Bend |
1 |
|
| Skinker |
|
|
| Forest Park |
|
|
| Lambert Main |
1 |
|
| Lambert East |
|
|
| North Hanley |
56 |
66 |
| UMSL North |
|
5 |
| UMSL South |
4 |
7 |
| Rock Road |
13 |
7 |
| Wellston |
3 |
4 |
| Delmar Loop |
|
|
| TOTAL |
84 |
90 |
St. Louis County Incidents
St. Louis Metropolitan Police Department
St. Louis City Incidents
|
|
2021 |
2022 |
| Quarter 1 |
21 |
21 |
| Quarter 2 |
10 |
|
| Quarter 3 |
20 |
|
| Quarter 4 |
10 |
|
- St. Louis City MetroLink boardings increased 20%
- Incident per MetroLink boarding is .00003 (3 incidents per 100,000 MetroLink Boardings)
Offense Types
Incidents by Station
| MetroLink Station |
2021 |
2022 |
| Shrewsbury |
2 |
3 |
| Skinker |
|
|
| Delmar Loop |
2 |
3 |
| Forest Park |
4 |
1 |
| Central West End |
|
|
| Cortex |
2 |
2 |
| Grand |
6 |
2 |
| Union Station |
|
2 |
| Civic Center |
4 |
4 |
| Stadium |
|
|
| 8th & Pine |
|
2 |
| Convention Center |
|
|
| Landing |
1 |
2 |
| TOTAL |
21 |
21 |
St. Louis City Incidents
St. Clair County Sheriff's Department
St. Clair County Incidents
|
|
2021 |
2022 |
| Quarter 1 |
34 |
49 |
| Quarter 2 |
42 |
|
| Quarter 3 |
41 |
|
| Quarter 4 |
83 |
|
- St. Clair County MetroLink boardings increased 15%
- Incident per MetroLink boarding is .00016 (16 incidents per 100,000 MetroLink Boardings)
- Nearly 50% of the incidents in Q1 were warrant arrests
Offense Types
Incidents by Station
| MetroLink Station |
2021 |
2022 |
| East Riverfront |
2 |
2 |
| 5th & Missouri |
2 |
8 |
| Emerson Park |
5 |
7 |
| Jackie Joyner-Kersee |
1 |
2 |
| Washington Park |
3 |
5 |
| Fairview Heights |
13 |
13 |
| Memorial Hospital |
2 |
5 |
| Swansea |
1 |
2 |
| Belleville |
2 |
1 |
| College |
1 |
3 |
| Shiloh-Scott |
2 |
1 |
| Alignment |
|
|
| TOTAL |
34 |
49 |
St. Clair County Incidents
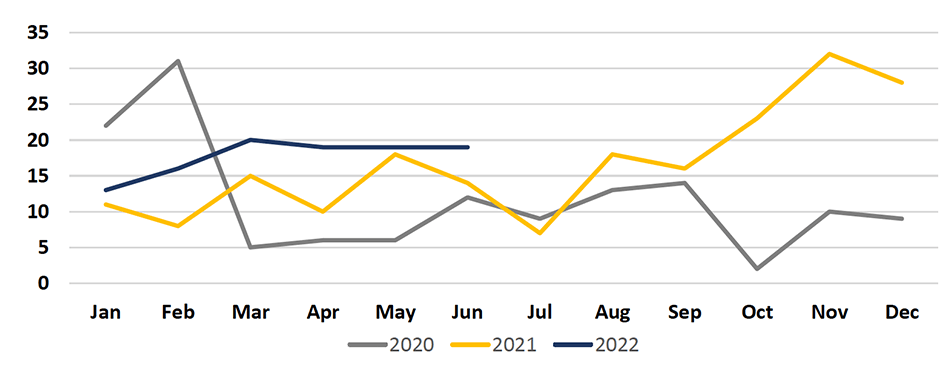
MetroLink Task Force Summary
Task Force Incidents
|
|
2020 |
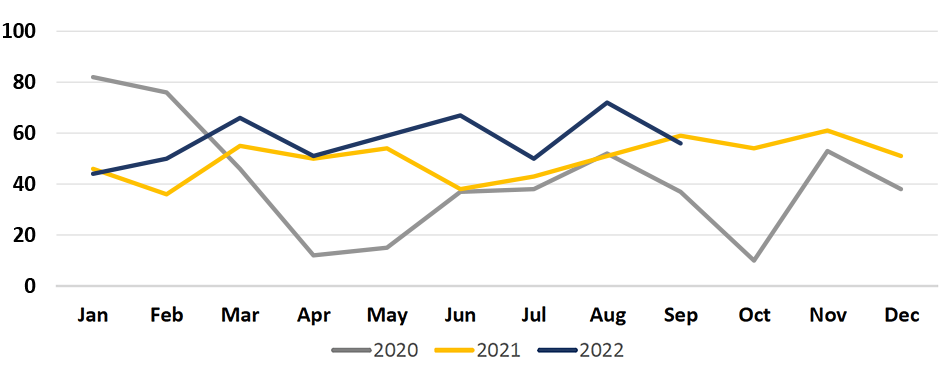
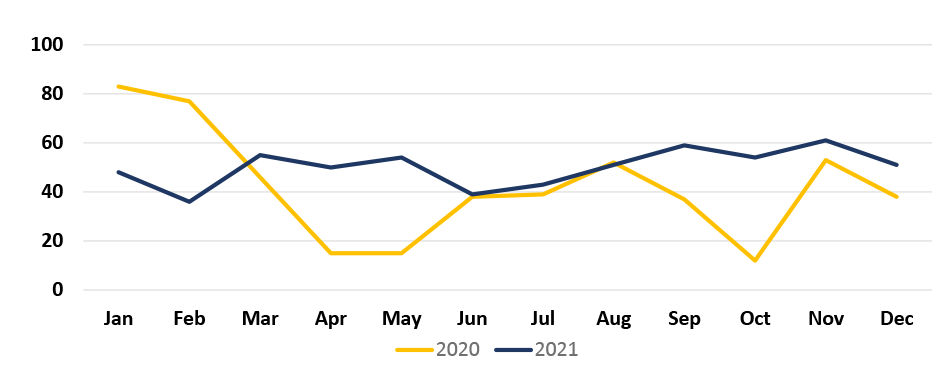
2021 |
| Quarter 1 |
206 |
139 |
| Quarter 2 |
68 |
143 |
| Quarter 3 |
128 |
153 |
| Quarter 4 |
103 |
166 |
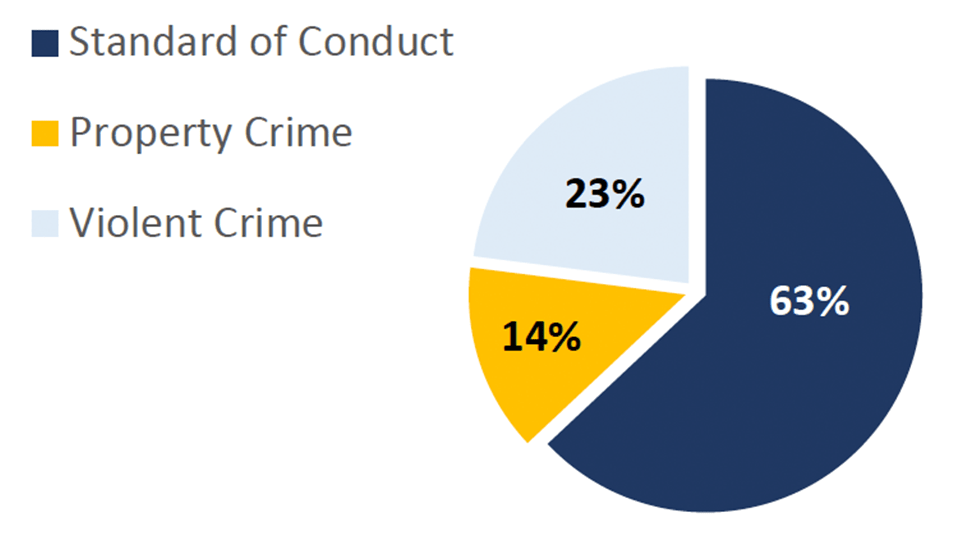
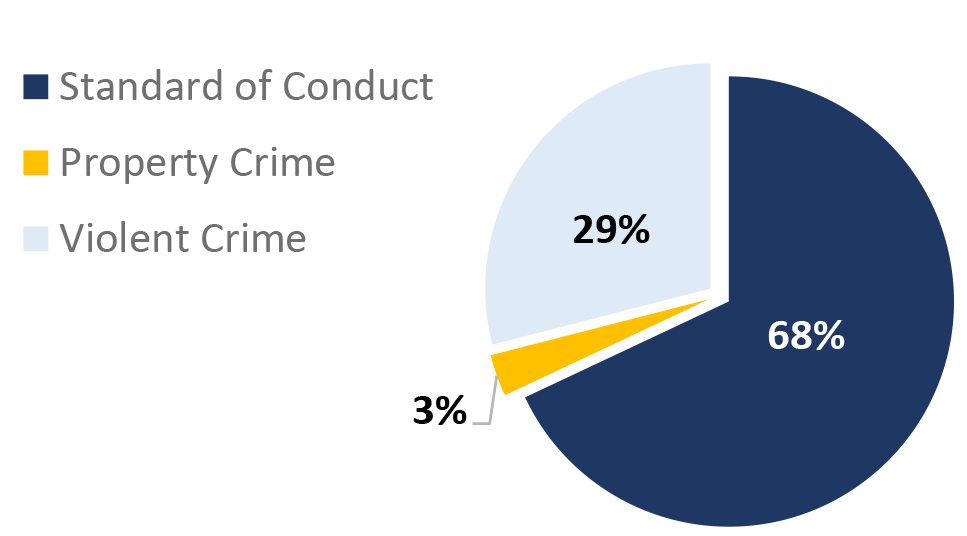
Offense Types
- MetroLink boardings increased 14%.
- Incidents per MetroLink boarding is .00011 (11 incidents per 100,000 boardings).
- The majority (66%) of incident reports were self initiated and generated by proactive policing.
- Over a third (37%) of Task Force Incidents were warrant arrest, likely the result of proactivity and the removal of know offenders from the system.
- Weapon violations account for 17% of the violent offense types. Likely the result of pro active initiatives targeting known ‘hot spots.’
- The majority of standard of conduct offenses are trespassing and drug violations.
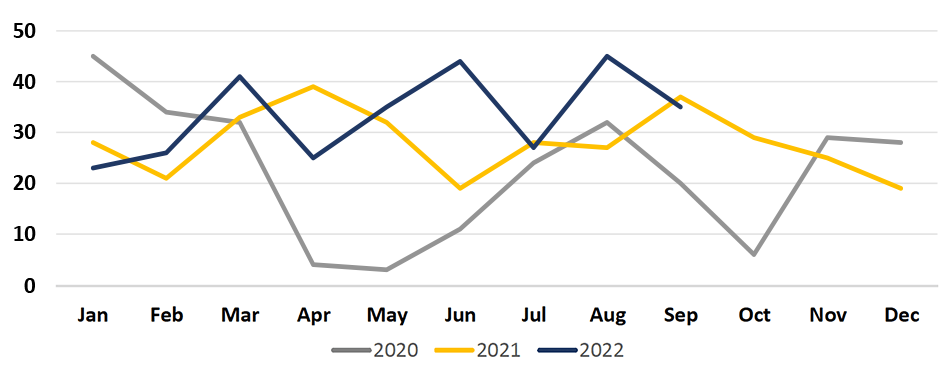
MetroLink Task Force Incidents
St. Louis County Police Department
St. Louis County Incidents
|
|
2020 |
2021 |
| Quarter 1 |
111 |
84 |
| Quarter 2 |
18 |
91 |
| Quarter 3 |
76 |
92 |
| Quarter 4 |
63 |
73 |
- St. Louis County MetroLink boardings increased 13%.
- Incident per MetroLink boarding is .00013 (13 incidents per 100,000 MetroLink Boardings).
Offense Types
Incidents by Station
| MetroLink Station |
2020 |
2021 |
| Shrewsbury |
2 |
1 |
| Sunnen |
|
|
| Maplewood |
1 |
2 |
| Brentwood |
1 |
1 |
| Richmond Heights |
1 |
1 |
| Clayton |
3 |
1 |
| Forsyth |
1 |
|
| U-City/Big Bend |
1 |
1 |
| Skinker |
|
|
| Forest Park |
|
|
| Lambert Main |
1 |
1 |
| Lambert East |
|
|
| North Hanley |
36 |
49 |
| UMSL North |
3 |
1 |
| UMSL South |
|
1 |
| Rock Road |
12 |
9 |
| Wellston |
1 |
4 |
| Delmar Loop |
|
1 |
| TOTAL |
63 |
73 |
St. Louis County Incidents
St. Louis Metropolitan Police Department
St. Louis City Incidents
|
|
2020 |
2021 |
| Quarter 1 |
36 |
21 |
| Quarter 2 |
22 |
10 |
| Quarter 3 |
15 |
20 |
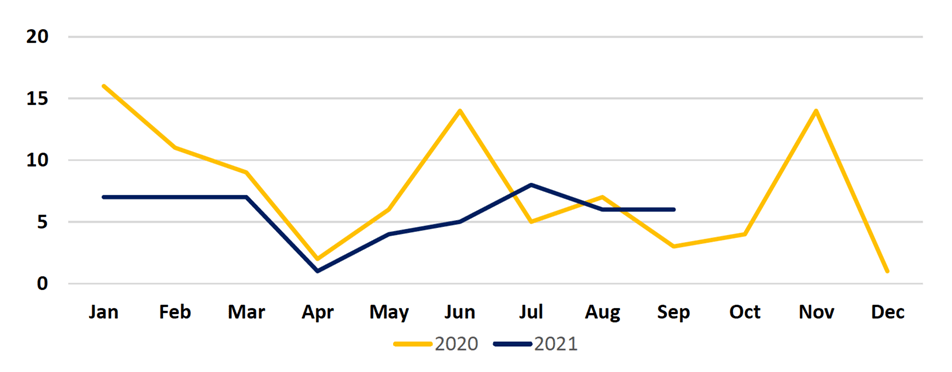
| Quarter 4 |
19 |
10 |
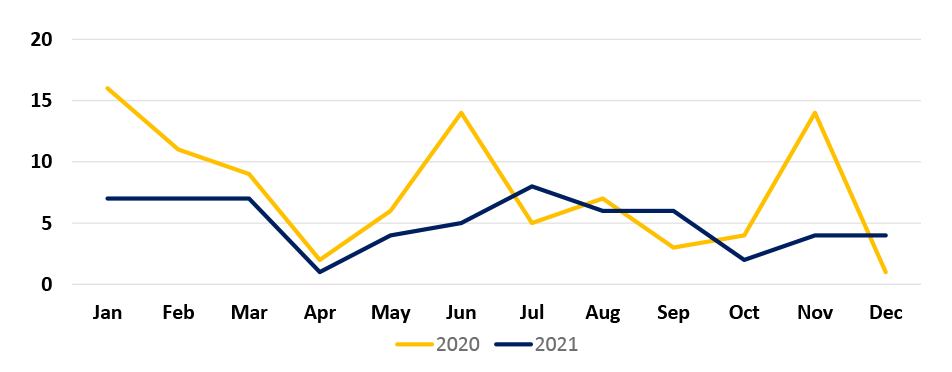
- St. Louis City MetroLink boardings increased 17%
- Incident per MetroLink boarding is .00002 (2 incidents per 100,000 MetroLink Boardings)
Offense Types
Incidents by Station
| MetroLink Station |
2020 |
2021 |
| Shrewsbury |
|
1 |
| Skinker |
|
1 |
| Delmar Loop |
1 |
1 |
| Forest Park |
2 |
1 |
| Central West End |
|
|
| Cortex |
2 |
2 |
| Grand |
3 |
|
| Union Station |
1 |
|
| Civic Center |
6 |
4 |
| Stadium |
|
|
| 8th & Pine |
2 |
|
| Convention Center |
|
|
| Landing |
|
|
| TOTAL |
17 |
10 |
St. Louis City Incidents
St. Clair County Sheriff's Department
St. Clair County Incidents
|
|
2020 |
2021 |
| Quarter 1 |
59 |
34 |
| Quarter 2 |
28 |
42 |
| Quarter 3 |
36 |
41 |
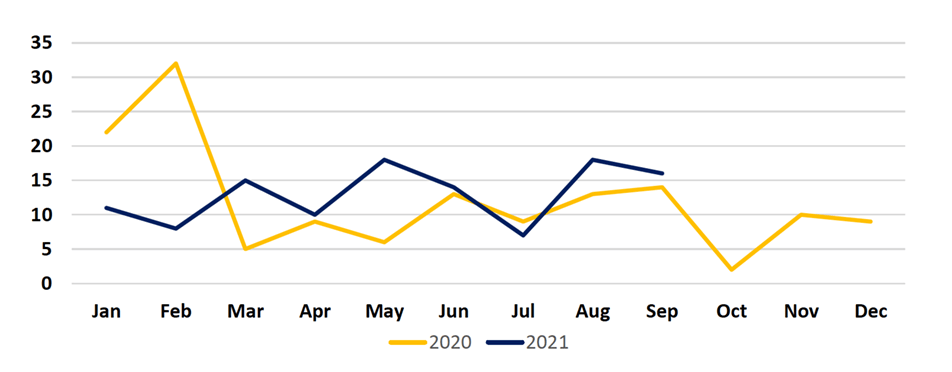
| Quarter 4 |
21 |
83 |
- St. Clair County MetroLink boardings increased 12%.
- Incident per MetroLink boarding is .00024 (24 incidents per 100,000 MetroLink Boardings).
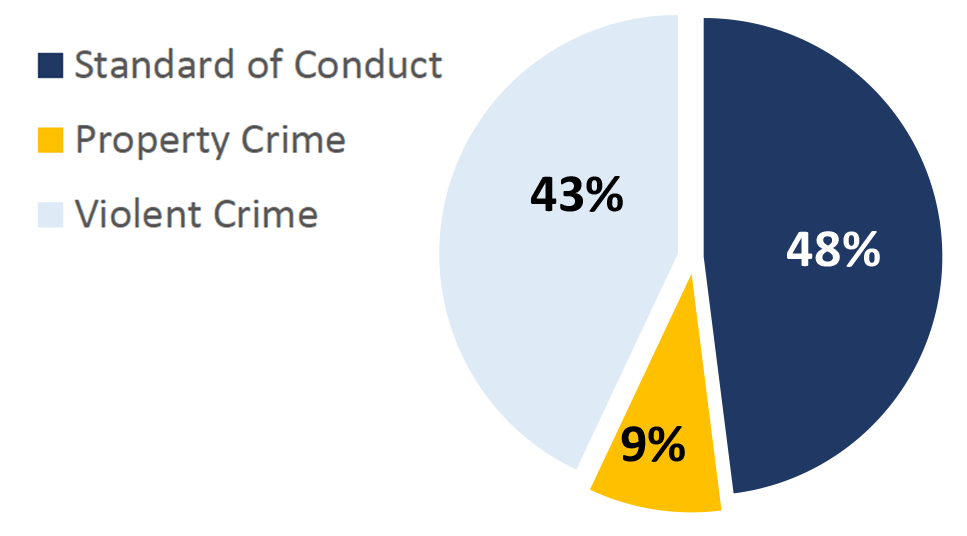
- Nearly 60% of the incidents in Q4 were warrant arrests.
Offense Types
Incidents by Station
| MetroLink Station |
2020 |
2021 |
| East Riverfront |
|
4 |
| 5th & Missouri |
4 |
13 |
| Emerson Park |
4 |
15 |
| Jackie Joyner-Kersee |
|
3 |
| Washington Park |
1 |
11 |
| Fairview Heights |
9 |
25 |
| Memorial Hospital |
1 |
1 |
| Swansea |
|
2 |
| Belleville |
|
6 |
| College |
|
1 |
| Shiloh-Scott |
2 |
1 |
| Alignment |
|
|
| TOTAL |
21 |
83 |
St. Clair County Incidents
MetroLink Task Force Summary
Task Force Incidents
|
|
2020 |
2021 |
| Quarter 1 |
206 |
139 |
| Quarter 2 |
68 |
143 |
| Quarter 3 |
128 |
153 |
| Quarter 4 |
103 |
|
Offense Types
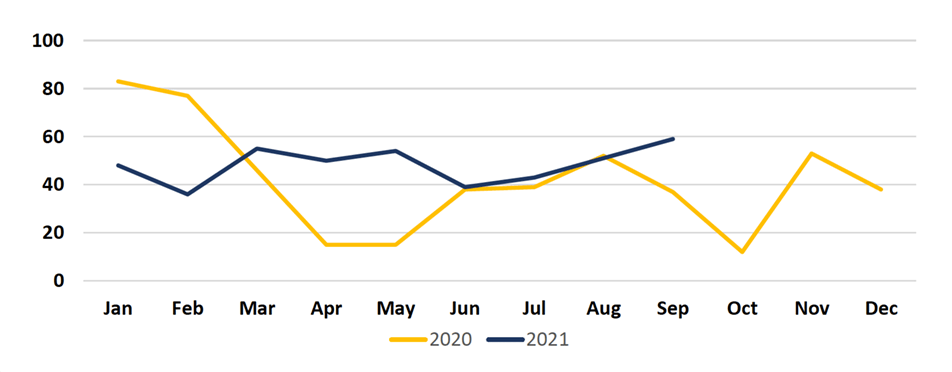
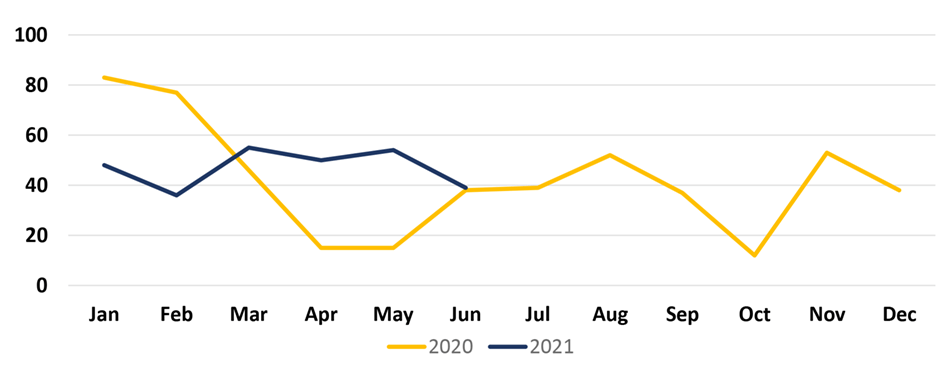
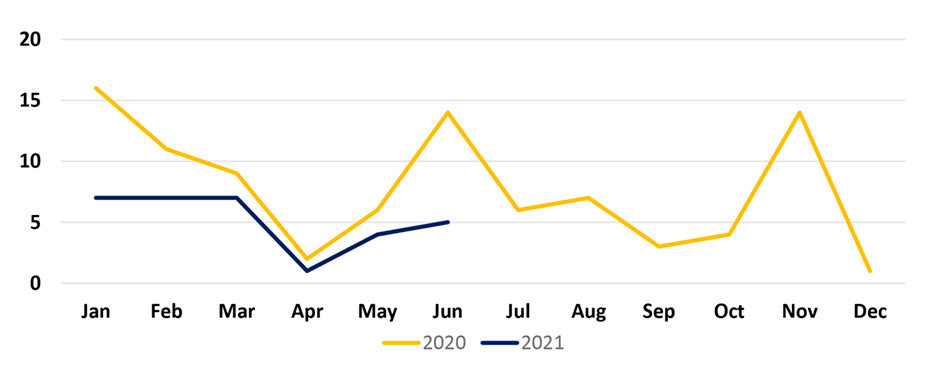
- COVID-19 reached the Bi-State region mid/late March 2020. MetroLink ridership decreased during Q2 & Q3 as many schools/businesses closed or operated remotely.
- Police limited exposure to the virus by reducing patrols and focusing on dispatched calls for service. The decrease in ridership and the reduction of proactive policing resulted in fewer incident reports for Q3 2020
- MetroLink boardings increased 15%
- Incidents per MetroLink boarding is .00009 (9 incidents per 100,000 boardings)
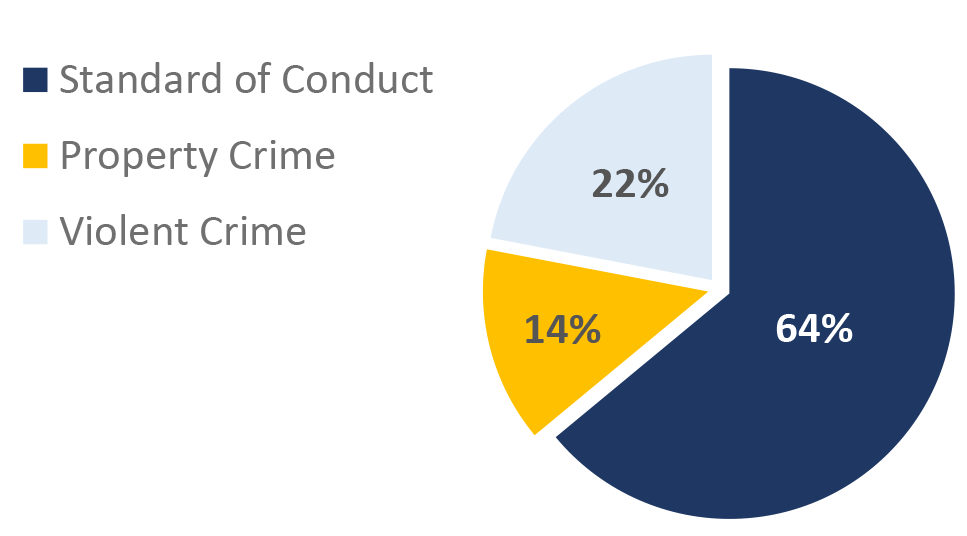
- 65% of incident reports were the result of self initiation/proactive policing
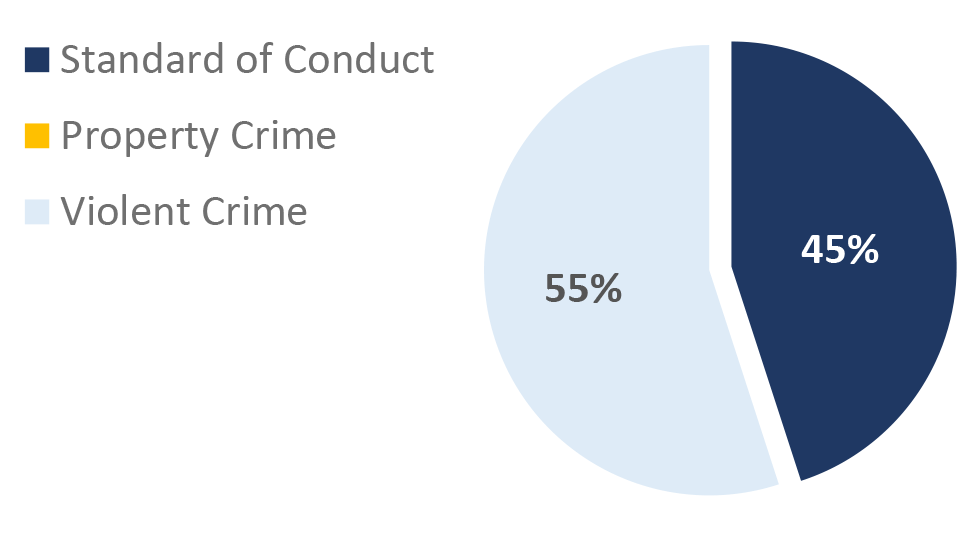
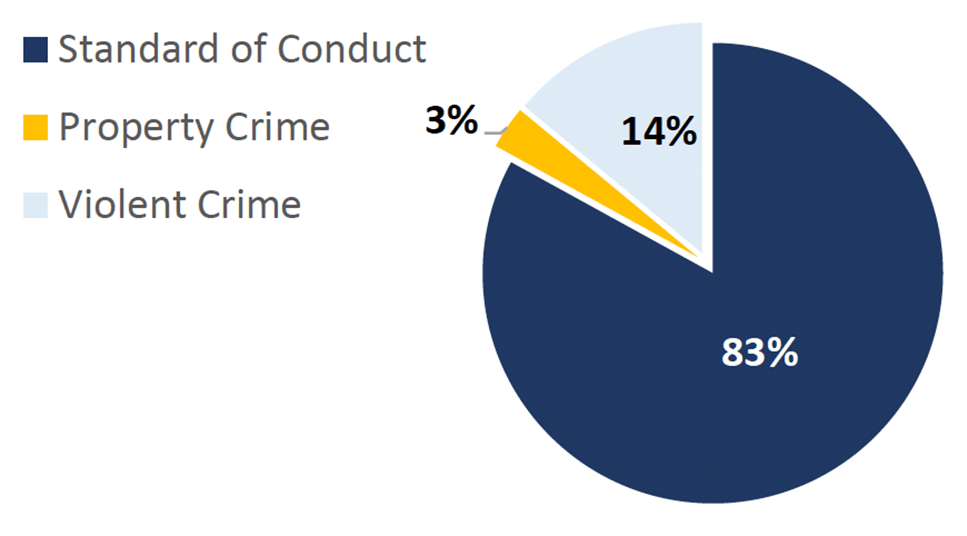
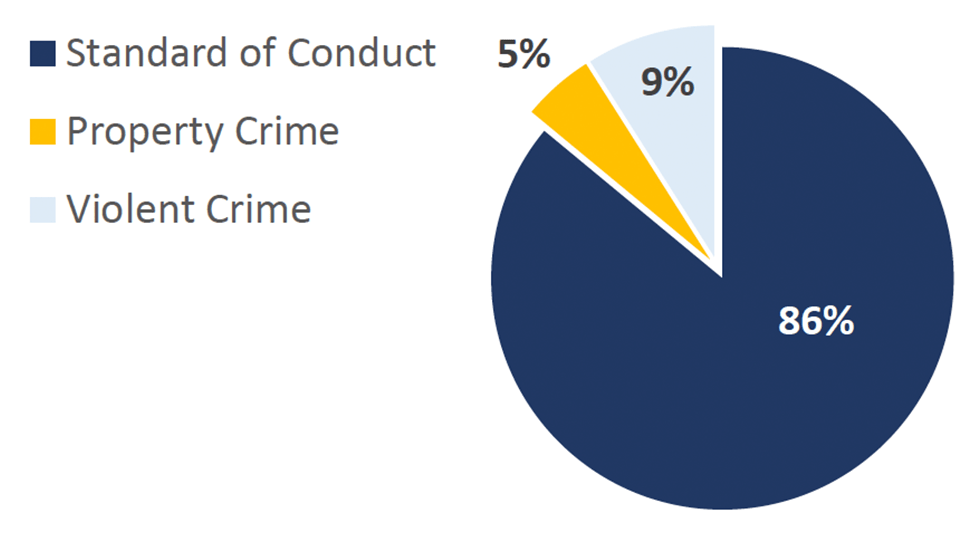
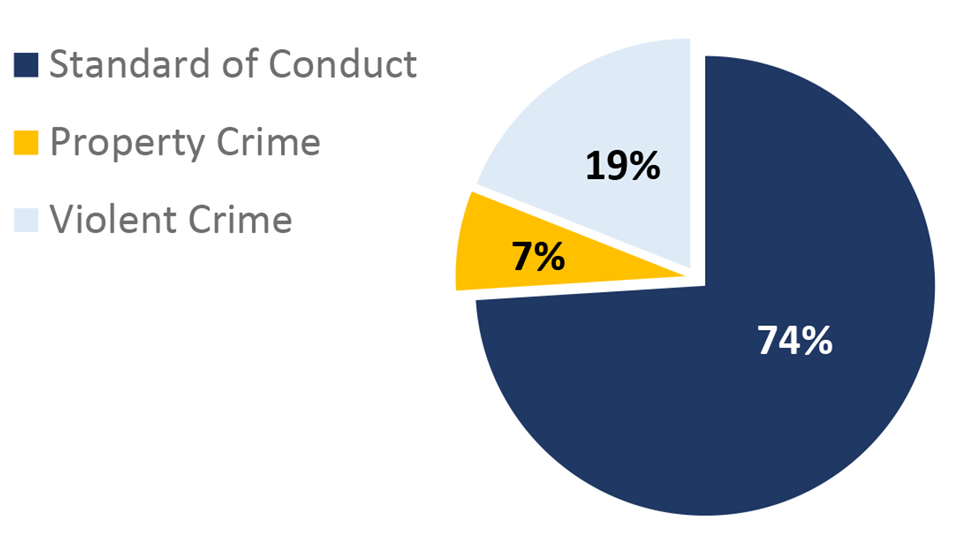
- Weapon violations account for 20% of the violent offense types Likely the result of proactive initiatives targeting known ‘hot spots.’
- The majority of standard of conduct offenses are drug, trespassing, and ordinance violations.
MetroLink Task Force Incidents
St. Louis County Police Department
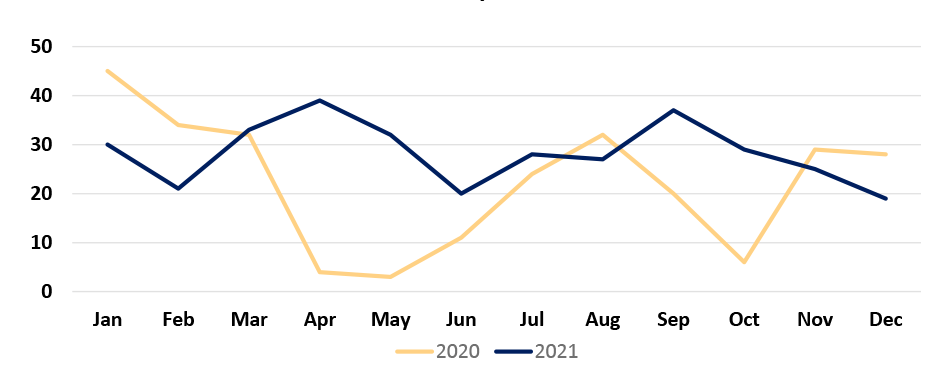
St. Louis County Incidents
|
|
2020 |
2021 |
| Quarter 1 |
111 |
84 |
| Quarter 2 |
18 |
91 |
| Quarter 3 |
76 |
92 |
| Quarter 4 |
63 |
|
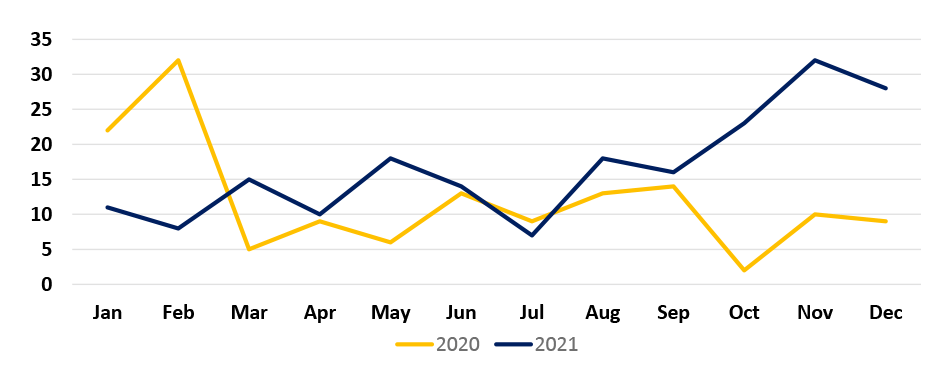
- St. Louis County MetroLink boardings increased 11%
- Incident per MetroLink boarding is .00016 (16 incidents per 100,000 MetroLink Boardings)
Offense Types
Incidents by Station
| MetroLink Station |
2020 |
2021 |
| Shrewsbury |
1 |
|
| Sunnen |
|
3 |
| Maplewood |
|
1 |
| Brentwood |
2 |
2 |
| Richmond Heights |
|
2 |
| Clayton |
2 |
4 |
| Forsyth |
|
2 |
| U-City/Big Bend |
1 |
|
| Skinker |
|
|
| Forest Park |
|
2 |
| Lambert Main |
2 |
1 |
| Lambert East |
|
|
| North Hanley |
57 |
58 |
| UMSL North |
1 |
|
| UMSL South |
1 |
3 |
| Rock Road |
7 |
8 |
| Wellston |
2 |
3 |
| Delmar Loop |
|
3 |
| TOTAL |
76 |
92 |
St. Louis County Incidents
St. Louis Metropolitan Police Department
St. Louis City Incidents
|
|
2020 |
2021 |
| Quarter 1 |
36 |
21 |
| Quarter 2 |
22 |
10 |
| Quarter 3 |
15 |
20 |
| Quarter 4 |
19 |
|
- St. Louis City MetroLink boardings increased 20%
- Incident per MetroLink boarding is .00003 (3 incidents per 100,000 MetroLink Boardings)
Offense Types
Incidents by Station
| MetroLink Station |
2020 |
2021 |
| Shrewsbury |
|
1 |
| Skinker |
|
|
| Delmar Loop |
|
1 |
| Forest Park |
6 |
3 |
| Central West End |
2 |
4 |
| Cortex |
2 |
2 |
| Grand |
3 |
3 |
| Union Station |
|
1 |
| Civic Center |
1 |
1 |
| Stadium |
1 |
|
| 8th & Pine |
|
1 |
| Convention Center |
|
1 |
| Landing |
|
2 |
| TOTAL |
15 |
20 |
St. Louis City Incidents
St. Clair County Sheriff's Department
St. Clair County Incidents
|
|
2020 |
2021 |
| Quarter 1 |
59 |
34 |
| Quarter 2 |
28 |
42 |
| Quarter 3 |
36 |
41 |
| Quarter 4 |
21 |
|
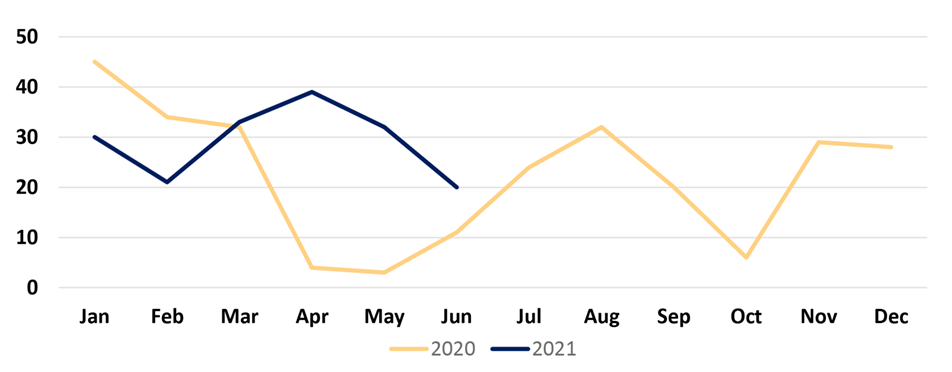
- St. Clair County MetroLink boardings increased 11%
- Incident per MetroLink boarding is .00011 (11 incidents per 100,000 MetroLink Boardings)
Offense Types
Incidents by Station
| MetroLink Station |
2020 |
2021 |
| East Riverfront |
2 |
2 |
| 5th & Missouri |
6 |
8 |
| Emerson Park |
4 |
8 |
| Jackie Joyner-Kersee |
2 |
2 |
| Washington Park |
3 |
2 |
| Fairview Heights |
11 |
16 |
| Memorial Hospital |
2 |
1 |
| Swansea |
|
1 |
| Belleville |
1 |
|
| College |
|
1 |
| Shiloh-Scott |
5 |
|
| Alignment |
|
|
| TOTAL |
36 |
41 |
St. Clair County Incidents
Definitions:
Incident: an event where one or more offenses are committed by the same offender(s) at the same time & location.
Incident Report: unofficial documentation of a security-related incident, completed by officers on the MetroLink Task Force; not the official crime report, please contact the individual police departments for official data.
Offense: criminal offense(s) that occur during an incident.
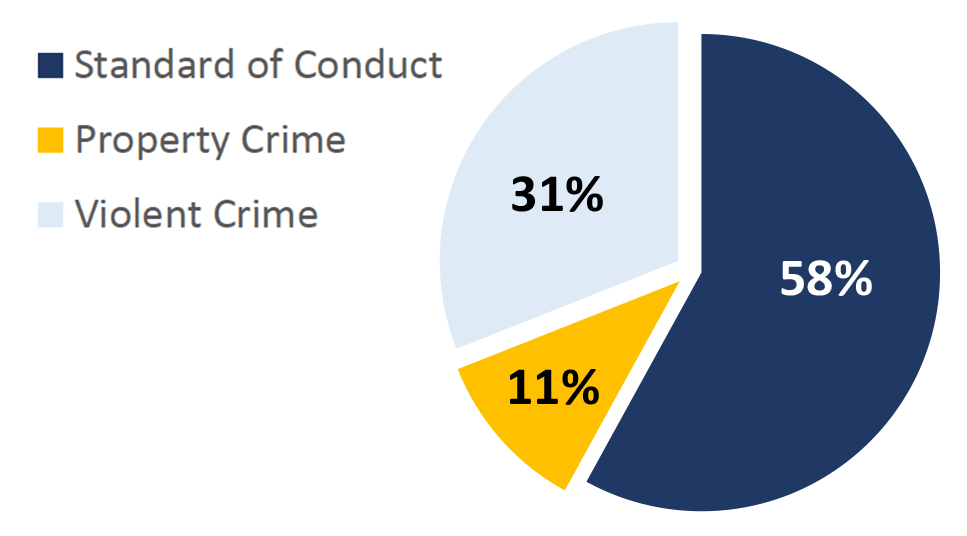
Offense Types: (Warrant arrests are not included in the offense categories)
Standard of Conduct Violations: crimes that are less serious, but that profoundly affect passengers’ perception of security and that consume a disproportionate amount of time and resources available to transit police and security forces (e.g., curfew & loitering laws, disorderly conduct, fare evasion, drug abuse violations, driving under the influence, drunkenness, sex offenses, trespassing).
Property Crimes: crimes that involve the property of the transit agency or the personal property of passengers & employees property (e.g., arson, burglary, larceny/theft, motor vehicle theft, vandalism).
Violent Crimes: all crimes that passengers/employees generally consider a potential threat to their personal safety (e.g., assault, homicide, rape, robbery, suicide/attempted suicide, weapons violation).
Proactive Policing: police work that deters crime, reduces disorder, reduces fear of crime, or remedies specific concerns in a given area; police action that occurs before a crime is committed

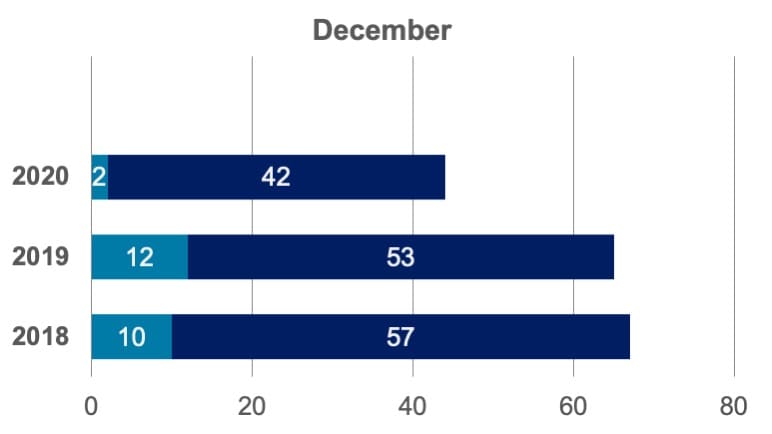 2020: Part 1 Crime = 2, Part 2 Crime = 42
2019: Part 1 Crime = 12, Part 2 Crime = 53
2018: Part 1 Crime = 10, Part 2 Crime = 57
2020: Part 1 Crime = 2, Part 2 Crime = 42
2019: Part 1 Crime = 12, Part 2 Crime = 53
2018: Part 1 Crime = 10, Part 2 Crime = 57
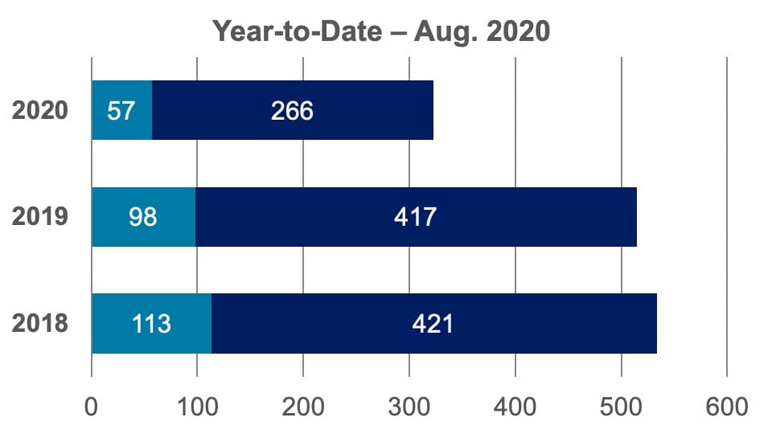
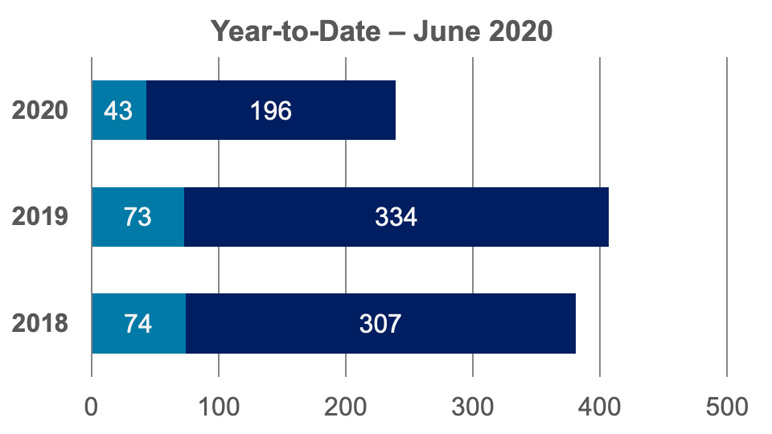
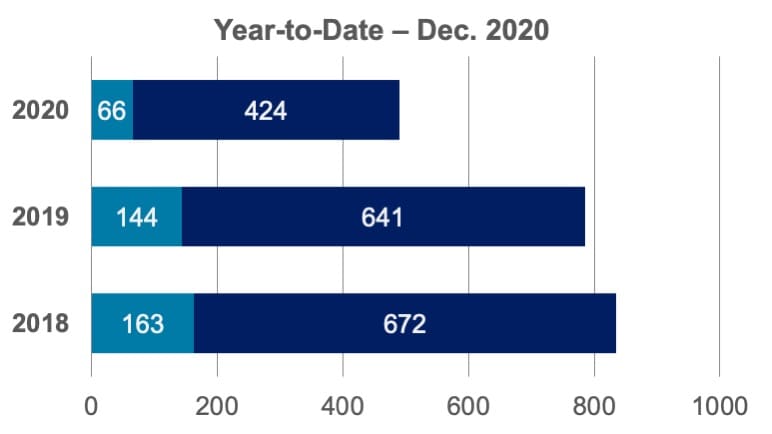 2020: Part 1 Crime = 66, Part 2 Crime = 424
2019: Part 1 Crime = 144, Part 2 Crime = 641
2018: Part 1 Crime = 163, Part 2 Crime = 672
2020: Part 1 Crime = 66, Part 2 Crime = 424
2019: Part 1 Crime = 144, Part 2 Crime = 641
2018: Part 1 Crime = 163, Part 2 Crime = 672
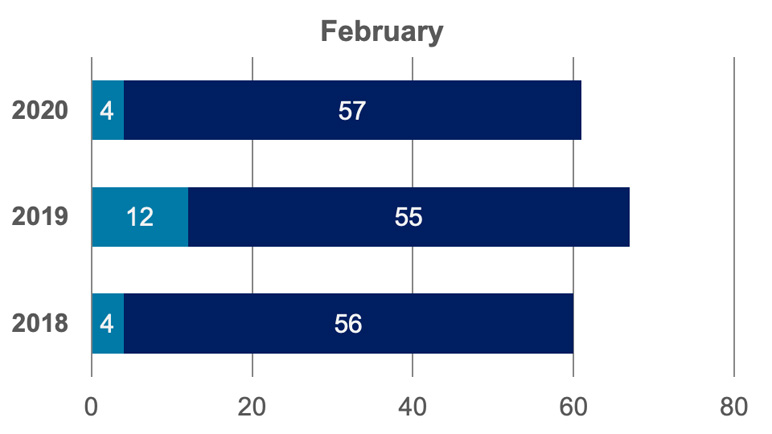
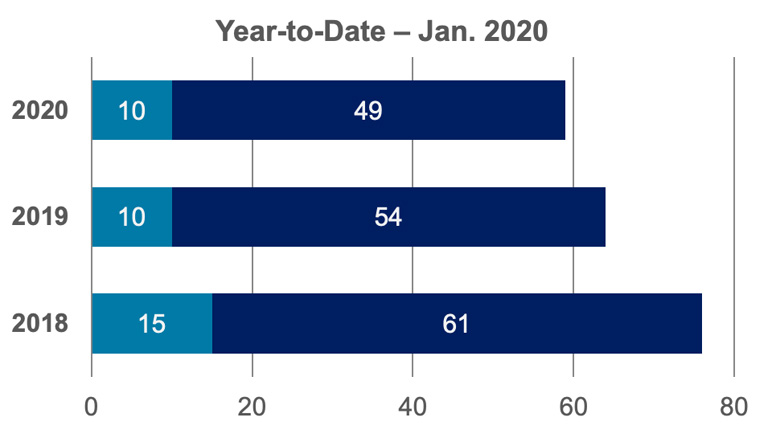
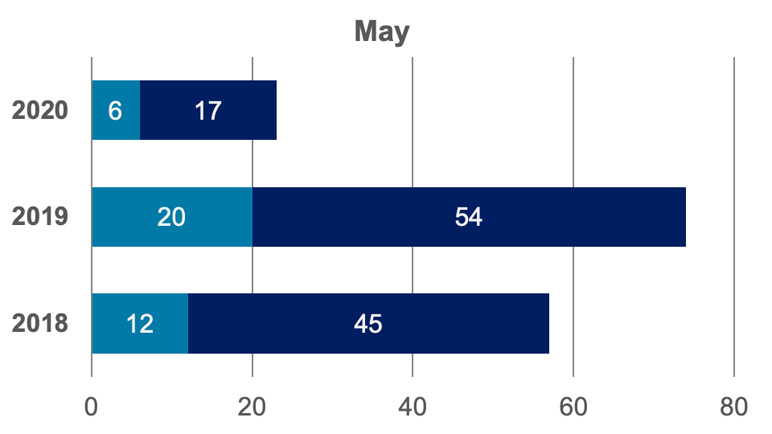
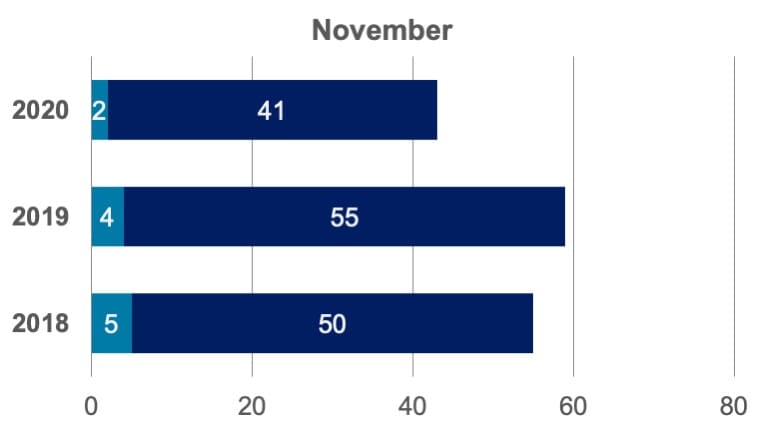 2020: Part 1 Crime = 2, Part 2 Crime = 41
2019: Part 1 Crime = 4, Part 2 Crime = 55
2018: Part 1 Crime = 15, Part 2 Crime = 50
2020: Part 1 Crime = 2, Part 2 Crime = 41
2019: Part 1 Crime = 4, Part 2 Crime = 55
2018: Part 1 Crime = 15, Part 2 Crime = 50
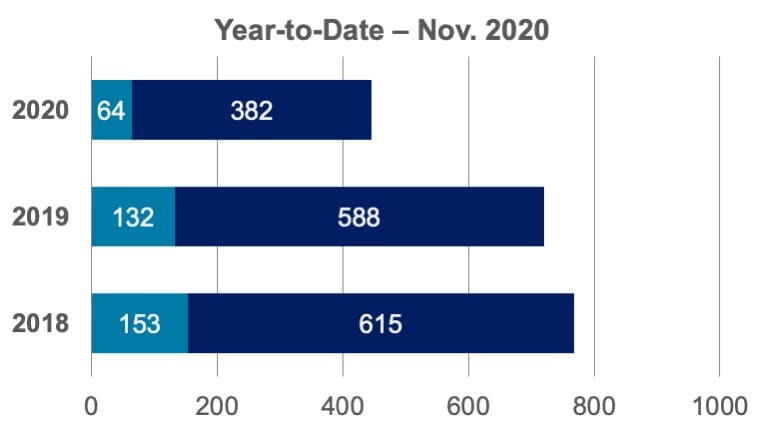 2020: Part 1 Crime = 64, Part 2 Crime = 382
2019: Part 1 Crime = 132, Part 2 Crime = 588
2018: Part 1 Crime = 153, Part 2 Crime = 615
2020: Part 1 Crime = 64, Part 2 Crime = 382
2019: Part 1 Crime = 132, Part 2 Crime = 588
2018: Part 1 Crime = 153, Part 2 Crime = 615
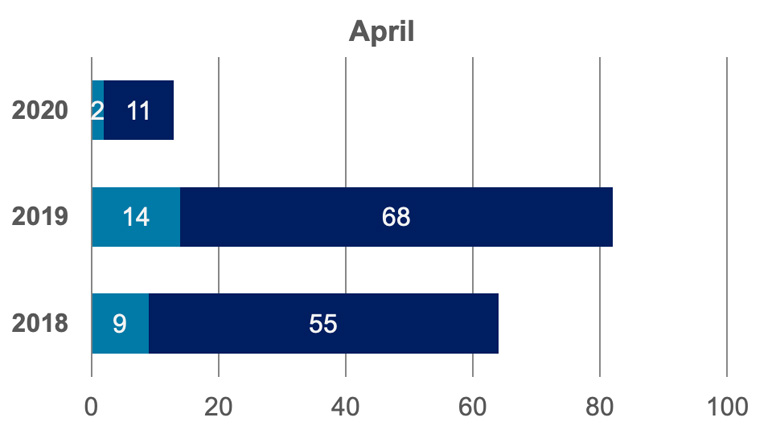
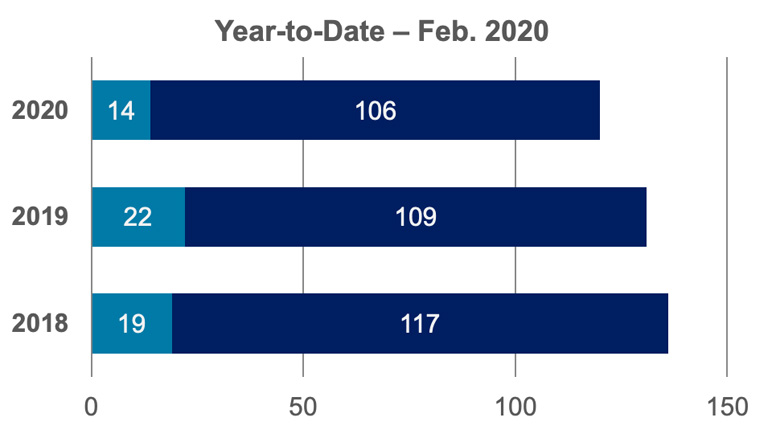
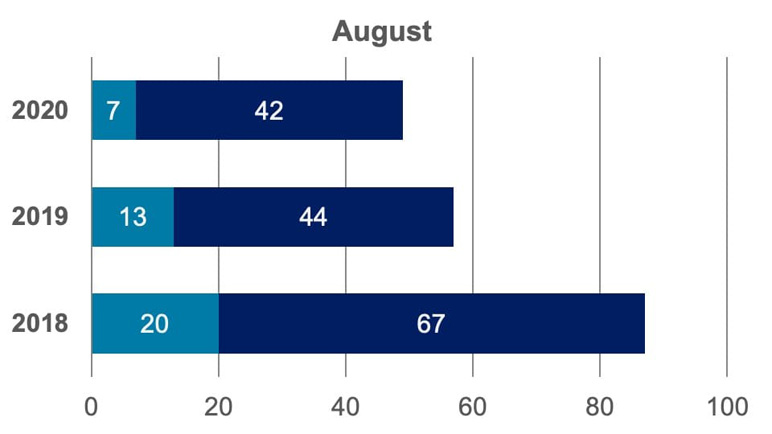
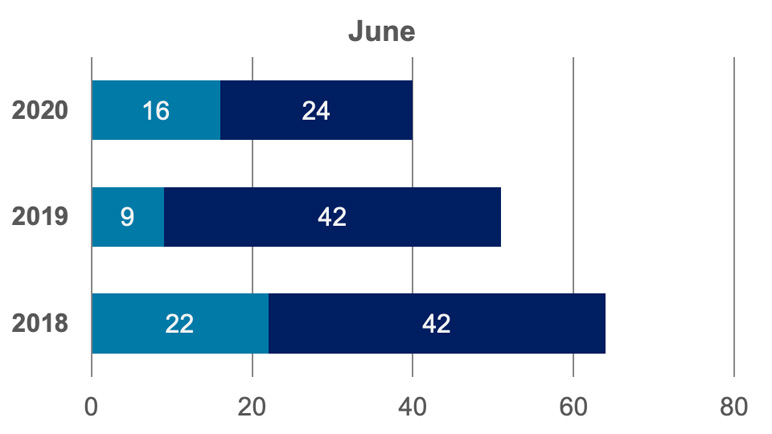
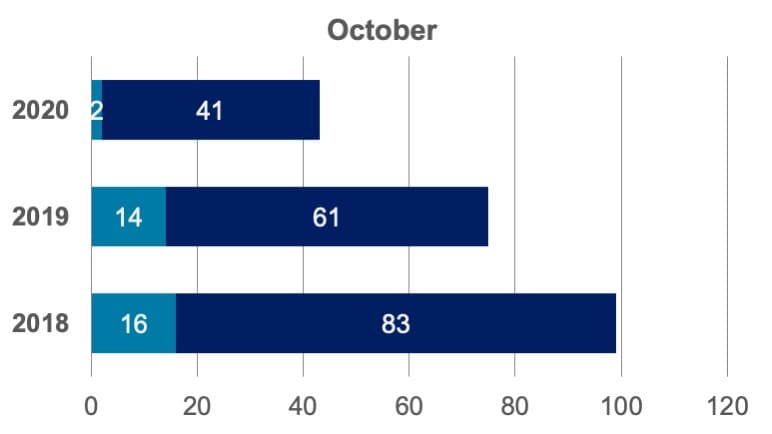 2020: Part 1 Crime = 2, Part 2 Crime = 41
2019: Part 1 Crime = 14, Part 2 Crime = 61
2018: Part 1 Crime = 16, Part 2 Crime = 83
2020: Part 1 Crime = 2, Part 2 Crime = 41
2019: Part 1 Crime = 14, Part 2 Crime = 61
2018: Part 1 Crime = 16, Part 2 Crime = 83
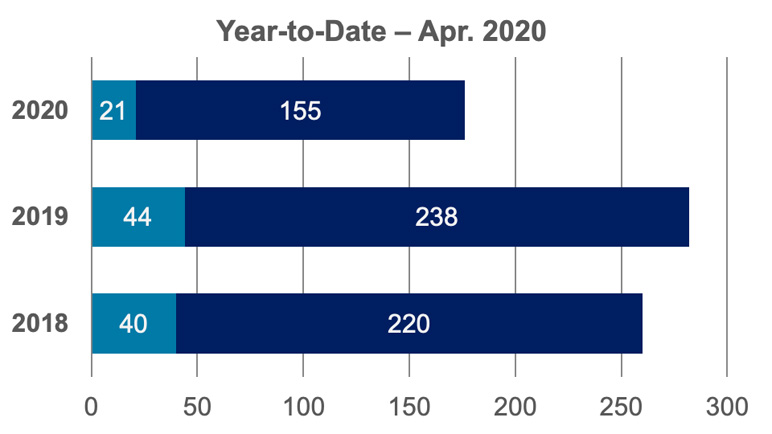
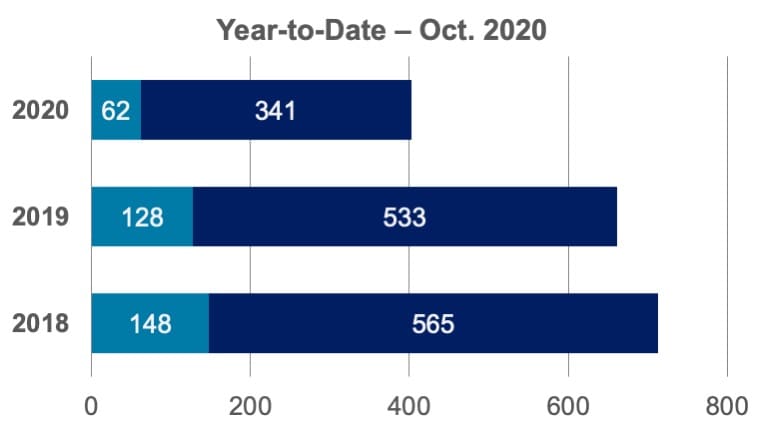 2020: Part 1 Crime = 62, Part 2 Crime = 341
2019: Part 1 Crime = 128, Part 2 Crime = 533
2018: Part 1 Crime = 148, Part 2 Crime = 565
2020: Part 1 Crime = 62, Part 2 Crime = 341
2019: Part 1 Crime = 128, Part 2 Crime = 533
2018: Part 1 Crime = 148, Part 2 Crime = 565
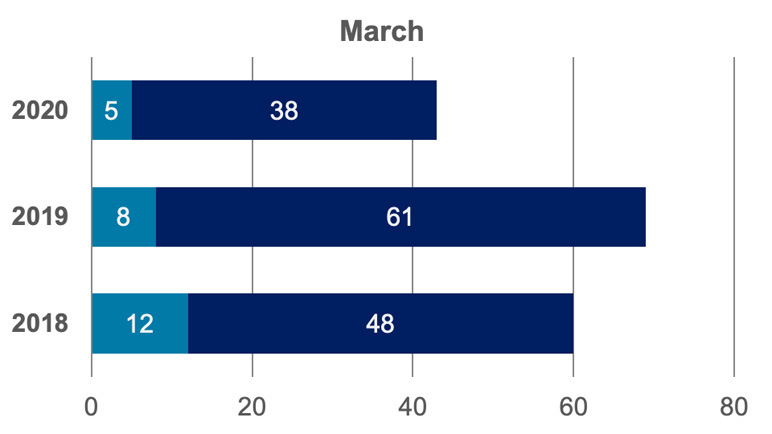
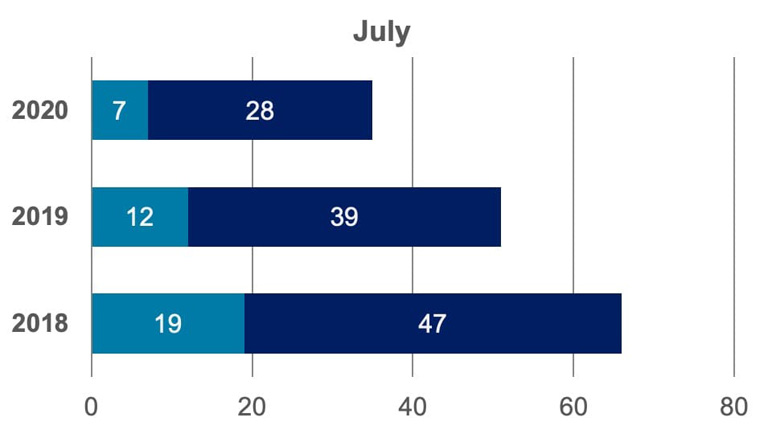
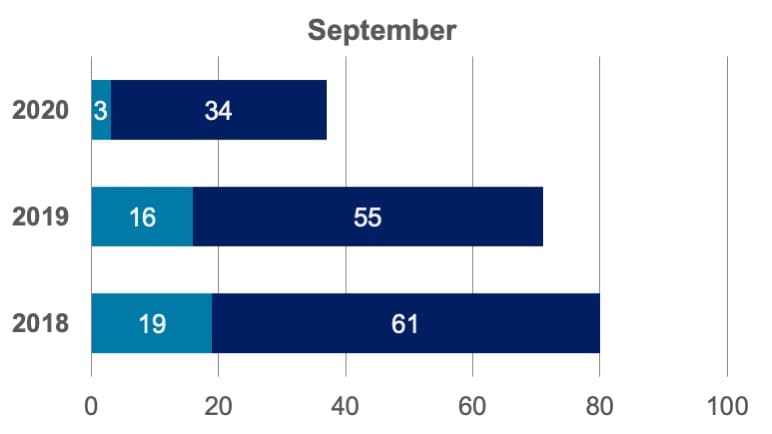 2020: Part 1 Crime = 3. Part 2 Crime = 34
2019: Part 1 Crime = 16. Part 2 Crime = 55
2018: Part 1 Crime = 19. Part 2 Crime = 61
2020: Part 1 Crime = 3. Part 2 Crime = 34
2019: Part 1 Crime = 16. Part 2 Crime = 55
2018: Part 1 Crime = 19. Part 2 Crime = 61
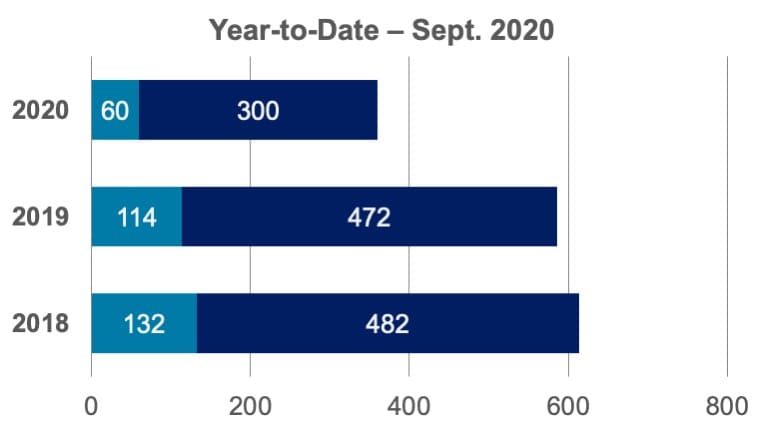 2020: Part 1 Crime = 60. Part 2 Crime = 300
2019: Part 1 Crime = 114. Part 2 Crime = 472
2018: Part 1 Crime = 132. Part 2 Crime = 482
2020: Part 1 Crime = 60. Part 2 Crime = 300
2019: Part 1 Crime = 114. Part 2 Crime = 472
2018: Part 1 Crime = 132. Part 2 Crime = 482
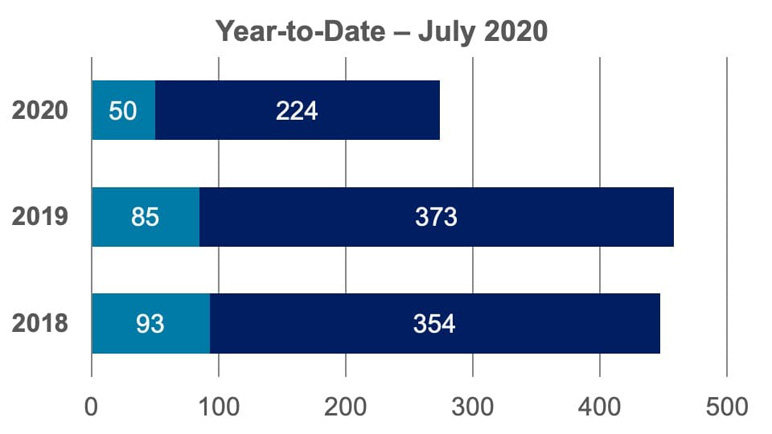
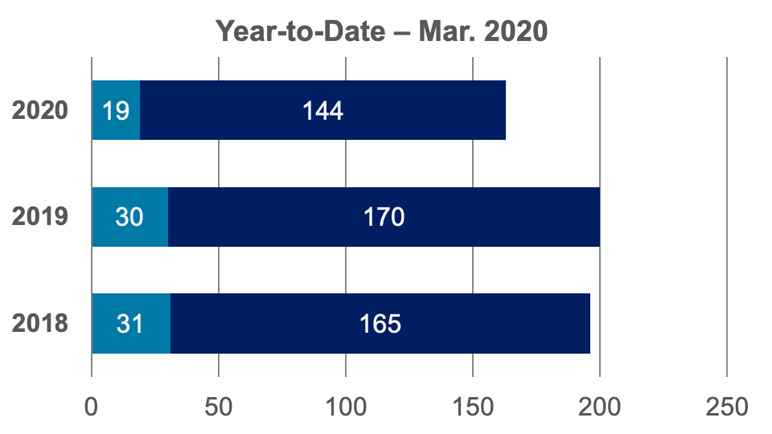
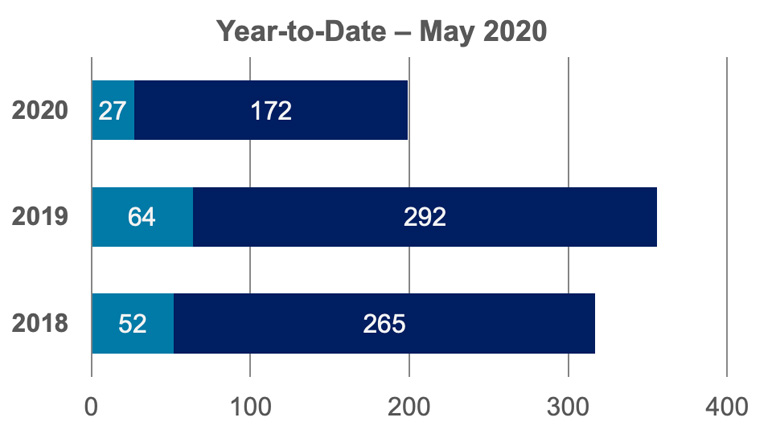 2020: Part 1 Crime = 27. Part 2 Crime = 172
2019: Part 1 Crime = 64. Part 2 Crime = 292
2018: Part 1 Crime = 52. Part 2 Crime = 265
2020: Part 1 Crime = 27. Part 2 Crime = 172
2019: Part 1 Crime = 64. Part 2 Crime = 292
2018: Part 1 Crime = 52. Part 2 Crime = 265